Federal Spending and Deficits
Spending and deficits used to be a battleground in federal elections as each party suggested reforms and blamed the other for fiscal irresponsibility. Candidates proposed tax and spending plans, and reporters examined whether the figures added up and what the impact might be.
These days, the leaders of both parties are ignoring the fiscal hurricane heading for landfall on our economy, while reporters rarely probe the politicians about the coming storm.
The Congressional Budget Office has released its latest outlook showing where the budget and economy may be headed. Without reforms, debt held by the public is projected to rise from 98 percent of GDP today to 195 percent by 2050. If Congress expands programs or the nation gets hit with new crises, debt will rise even faster. Americans in the future will face their own costly health, military, and other challenges, and they will have to bear those new costs plus the costs of our excess spending imposed on them through debt.
In its usual understated way, the CBO summarizes the threat:
High and rising federal debt makes the economy more vulnerable to rising interest rates and, depending on how that debt is financed, rising inflation. The growing debt burden also raises borrowing costs, slowing the growth of the economy and national income, and it increases the risk of a fiscal crisis or a gradual decline in the value of Treasury securities.
Here are some charts from the CBO study:
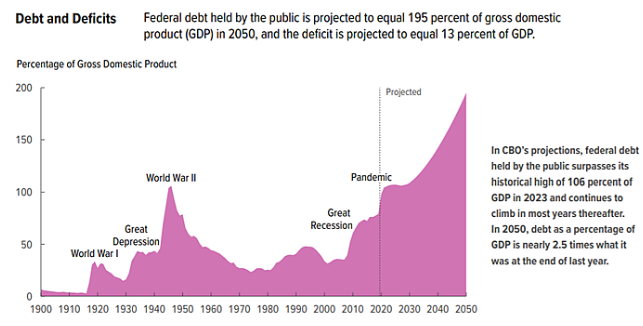
The first chart shows that federal debt spiked in the past from wars and other crises, and that debt will soar to record levels in the future even under CBO’s smooth‐sailing economic projections.
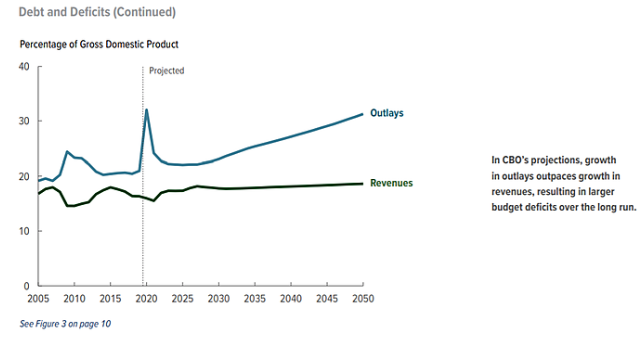
Washington has a spending problem, not a revenue problem. The next chart shows that, without law changes, tax revenues will remain a fairly stable share of the economy, while spending rises rapidly because large federal programs are on an auto‐pilot growth path.
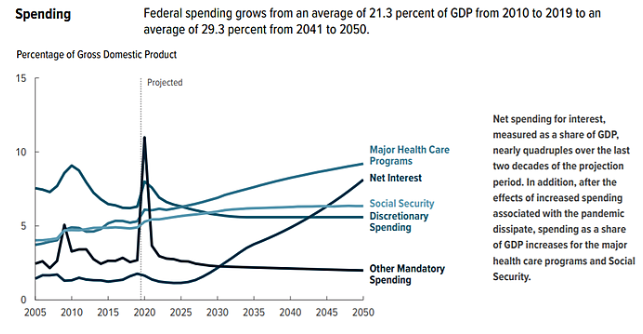
This next chart shows the growth of federal spending categories under CBO assumptions. The downward slope of the “discretionary” and “other mandatory” lines may be optimistic because Congress occasionally spikes spending on those categories and each of the programs within the categories have lobby groups pushing for more.
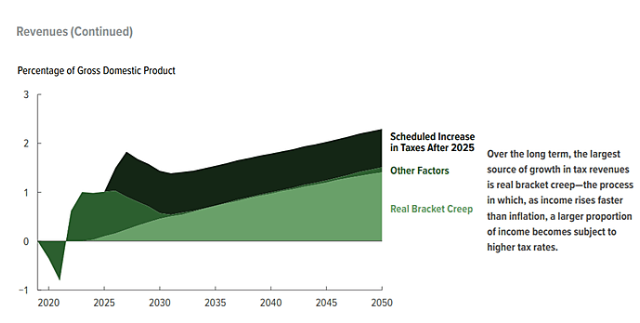
Tax revenues are expected to edge upward in coming years even without legislated increases. The next chart shows that real bracket creep and expiring tax breaks will boost the federal tax share of the economy.
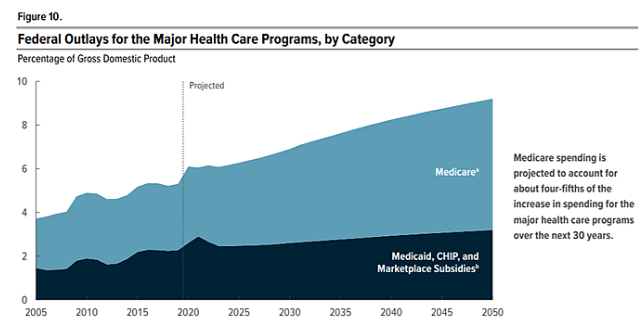
The last chart shows the largest cost driver in the federal budget—health care. One of the presidential candidates plans to expand government health care, yet both parties have failed to tackle the ballooning costs of the health programs we already have.
How should we tackle the budget crisis? Downsizing Government proposes many spending cuts.