Finally, Crime Stats You Can See on a County Website
By County Commissioner Bruce Mattare
You can thank the city of Hayden for this one.
When I was working with Commissioner Eberlein last year on updating the Hayden Law Enforcement contract (so the county would be fully reimbursed for the cost of a sheriff’s deputy), I noticed something that has not happened as long as I’ve been your county commissioner. In the contract it stated that the Sheriff’s Office was to provide a monthly update to the City Council on crime stats.
This deliverable stood out because the BOCC has not had one presentation of county crime stats by our Sheriff’s Office. Why not?
It’s Time to Put More Information at Your Fingertips
I ask because a presentation to the BOCC is the same as a presentation to you. The meetings are recorded and available for you to review at your leisure. It’s also a presentation that the local media can report to you about.
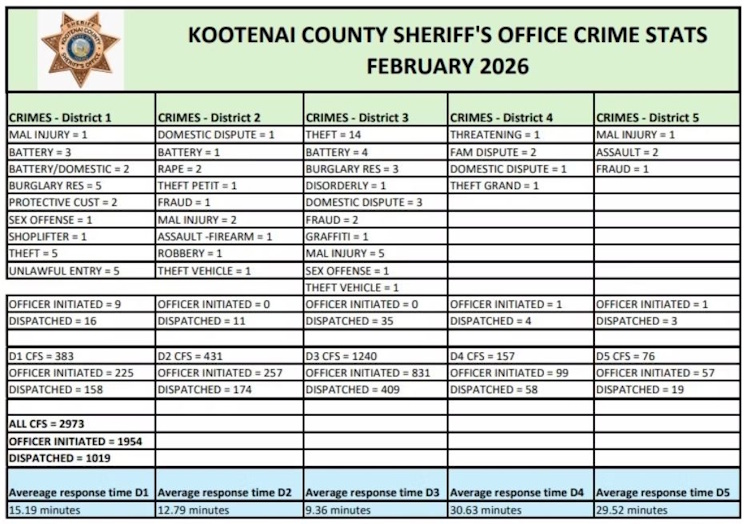
Is crime rising, falling or remaining flat? What is the average response time? These are basic questions that (when asked) you should have answers that are easily accessible on your county website. And soon they will be.
As of today, the most recent crime stats that can be found are from 2016 on the Sheriff’s Office website. Yes, 2016.
We will begin to provide these updated stats and additional charts, graphs and figures for your review as soon as the Sheriff’s Office provides us with updated reports. Thereafter we will update monthly.
This is all part of my effort to make available information about what is happening in your county government. The most recent expansion of information can be found at our Growth Dashboard by clicking here.
What to Expect Moving Forward
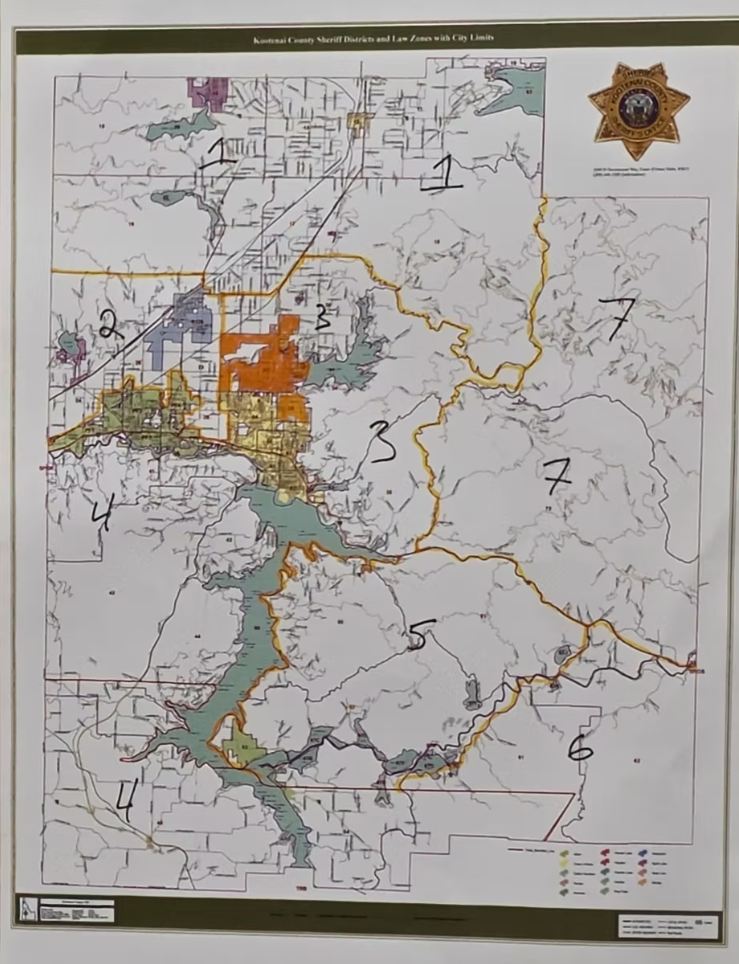
My hope is we can begin with the past 12 months so you can see trends and any other relevant information for your district. For those of you who want to understand the chart above, the crime stats are reported by district within the county. I placed an image of the district map below so you can see where the crimes are happening.
As a side note, the good news is that for the first time in recent county history, the county is getting paid the full 100% cost of a sheriff’s deputy. We are no longer subsidizing that cost for the city.
Meanwhile, here’s the video of our recent meeting about this subject. There was a surprising twist during it. Below the video is the District map so you can see which district you live within.
Here’s the district county map so you can see what district you reside within.