The impact of CO2 is overstated so why dismantle society? Part 1
That is a great question, and yes, there is a chance that it could happen. But it would not be meaningfully caused by humans burning fossil fuels and producing more CO2.
Additional CO2 in our atmosphere stopped having a meaningful role in the earth’s temperature when it reached 300 parts per million, and that portion of our atmosphere that absorbs CO2 was all used up. Seriously that is a fact. So today, adding any amount of more CO2 has no impact on climate whatever. If CO2 doubled from the present 420 parts per million (PPM) to 840 PPM, the earth would just get greener, and crops would increase their yields on every farm and every forest. There would be no negative impacts at all. Atomic submarines travel the world underwater with an average CO2 content of over 5,000 PPM. Yes, that is a 5, followed by 3 zeros, and no sailor has ever gotten ill. If you doubt us, it is because you have been conned by the left and its control of the media to scare you needlessly.
Carbon Dioxide has less to do with global warming, global cooling, or global temperature remaining constant than we have been told. But attempts to reduce or eliminate fossil fuels will bring untold misery and deaths to a considerable portion of humanity. And the saddest part is that it will have been done for no scientific climate change reason. Instead, it would be a repeat of the insanity of the Salem Witch Trials of four hundred years ago, during the last Grand Solar Minimum.
Many well-intentioned “scientists” have become dependent on the US Government’s political grants for their lifestyles, tenures, and fortunes. So maybe they console their guilt by telling themselves that nobody would be foolish enough to actually try to decarburize the planet. And in fact, that may be true as it is impossible.
But clearly, governments are trying to do it. Unfortunately, the decarbonizing effort is inflicting damage in the two years it has been tried. Fuel shortages are occurring, energy costs are rising, and inflation can be seen everywhere. All the while, CO2 continues to increase anyway.
We will make a strong effort in this two-part series to convince you why we must stop this nonsense that CO2 and the greenhouse effect cause global warming and the end of life as we know it. Instead, we should resume and accelerate our discovery and recovery of more fossil fuels such as oil and gas, and yes, even coal.
For ease of understanding, we will forgo the complex scientific explanations and present an easy-to-understand record of temperatures and related climate and weather events as evidence. But if you wish to get more into the mathematical, scientific arguments, check out the endnotes and start with the first one. [a][A]
From Figure-1, taken from endnote [b][B], we see the UAH (University of Alabama Huntsville) global satellite temperature since 1979 when we launched our first weather satellites. We use this data set because it contains the temperatures recorded by very accurate satellite instruments. NASA/NOAA prefers to use their surface temperatures because they are easy to manipulate, which is done to support the government’s CO2 global warming position. NOAA is constantly doing it. [c][C].
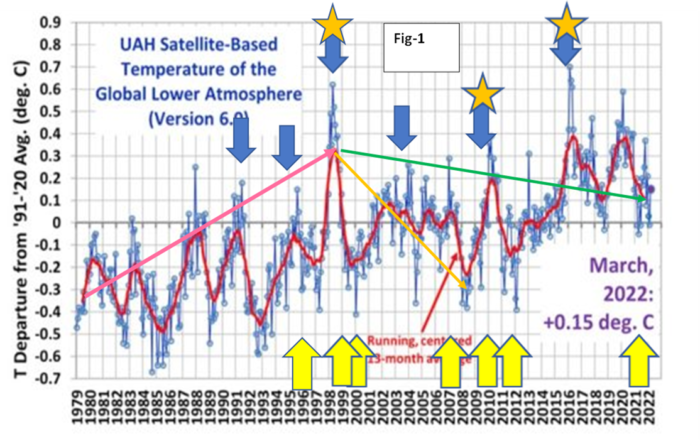
To the primary UAH temperature record, we have added additional information that makes significant contributions to the causes and extent of the global temperature record. There is a great deal of information presented here, but you will find it easy to understand. We will explain Figure 1 step by step. Give us a few minutes, and you will see it is not complicated once you get a feel for the various activities at work in our solar system. Believe us; they dwarf the insignificant role of our carbon dioxide emissions in our earth’s temperature.
The light blue vertical lines with the small circles on their ends are the temperatures recorded each month. The dark red line is a running 13-month average of these temperatures, and there is a horizontal line which is the average of all the recorded temperatures. Each temperature is recorded as a deviation from this zero baseline.
For example, the blue line temperature for 1979 was about -0.4 0 C colder than the average zero baselines. For 1998, the little blue line/circle shows a temperature of about +0.6 degrees C above the baseline temperature. Thus by 1998, the temperature increase was about 1.0 degrees C warmer than in 1979. For 1979, the red running temperature average was about -0.35 degrees C, and for 2000 about -0.20 degrees C, giving us a temperature increase of about 0.15 degrees C, which means that the temperature for 2000 was essentially the same as it was in 1979. Therefore, there was no global warming during that period.
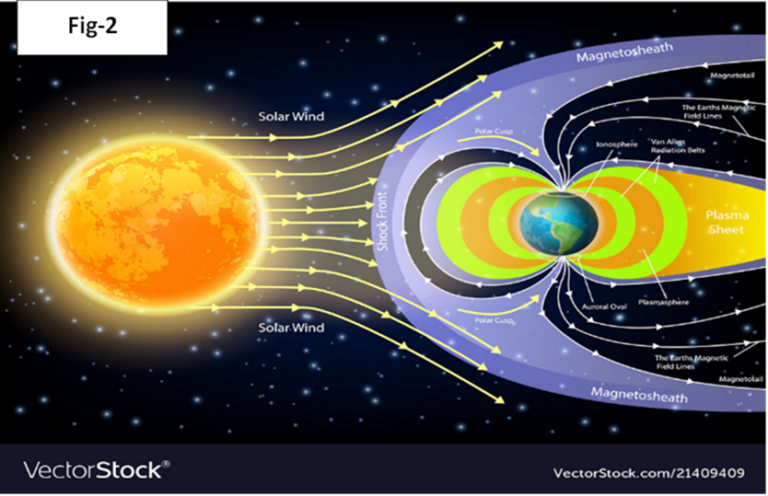
Now let us look at the big picture. The first thing to note is the red arrow trend that we added shows a global temperature increase from 1979 until 1998 of about 0.6 degrees C. (0.3 + 0.3). [d][D] Now solar scientists know why this increase happened as it corresponds to a period of powerful solar magnetic activities, and the scientific explanation is two-fold. First, during periods of high solar activities, as we had from 1979 to 1998, the earth received a tiny bit more solar energy called Total Solar Irradiance (TSI.) But during this same period, the sun also sent toward the earth, and all the planets in our solar system, with powerful solar winds and additional magnetic fields.
In Figure-2, we see a conceptual image of these powerful solar winds’ effects and how they shield the earth from much of the Galactic Cosmic Rays (GCR) approaching the earth. This is important because it is known that an increase in GCR entering the earth results in increased cloud formation. [E][e] So, during periods of high solar activities, fewer GCR enter the earth, and cloud cover decreases, allowing the earth to receive more TSI and thus warming the earth. But the exact opposite happens during periods of reduced solar activities, as shown by the green arrow trend line in Figure-1 from 1999 to March 2022. More Galactic Cosmic Rays entered the earth, forming more cloud cover, and the earth cooled a bit.
We have only added a couple of terms to consider TSI (Total Solar Irradiance) and GCR (Galactic Cosmic Rays). So next time you go out with friends, you can dazzle them with your knowledge of the solar system and concurrently attempt to eradicate in their minds the arrogant idea that we humans have control of the earth’s thermostat.
In Part 2 of this series of articles, we will write about the sunspots you have heard of but do not really understand, along with the role of El Nino and La Niña, which have long confused you. If you don’t know that volcanoes at the ocean bottom are way more important than us, we will let you know that as well.
Please tune in to CFACT.org next week to learn more about the simplicity of learning how inconsequential humankind is in the scheme of our solar system.
__________________________________
Sources and references: (we have cited all references here for both Parts 1 and 2, so not all references will be cited in part 2)
A [a] Read “why CO2 and greenhouse effect do not cause global warming.” https://www.academia.edu/76652255/Revised_Why_cant_CO2_and_greenhouse_effect_cause_global_warming
B [b] UAH Satellite global temperature see details at https://www.drroyspencer.com/latest-global-temperatures/
C [c] NASA/NOAA adjusting/fudging global climate record. This article provides evidence of the fudging and adjustments made by NOAA to the surface temperatures. The paper argues that absent these adjustments. We may already be a climate pause or possibly even a decline since the 1930s. https://electroverse.net/u-s-has-been-cooling-since-the-1930s/
D[d] TSI record last 50 years https://www.reddit.com/r/climateskeptics/comments/9ft7s2/do_you_know_why_solar_irradiance_has_diverged/
E[e] Read the article “Geomagnetic Reversal: The Svensmark Effect Revealing the Impact of Cosmic Rays on the Earth, Friday, July 5, 2019. https://www.ineffableisland.com/2019/07/geomagnetic-reversal-svensmark-effect.html#:~:text=Geomagnetic%20Reversal%3A%20The%20Svensmark%20Effect%20Revealing%20the%20Impact,by%20increasing%20cloud%20cover%2C%20causing%20an%20%E2%80%9Cumbrella%20effect%E2%80%9D.
F[f] Modern Grand Solar Minimum will lead to terrestrial cooling, by Valentina Zharkova https://www.ncbi.nlm.nih.gov/pmc/articles/PMC7575229/
G[g] El Nino/La Nina years 1990 -Jan 2022, source https://ggweather.com/enso/oni.htm
H[h] El Nino-La Nina are caused by the earth’s geologic activities and not changes in heat circulation patterns. See http://www.plateclimatology.com/why-el-nio-and-la-nia-are-one-continuous-geological-event/ . Also, see this article describing their cyclic nature. See paper titled “Seafloor Volcano Pulses May Alter Climate, February 5, 2015″ https://www.earth.columbia.edu/articles/view/3231
[I] [i] https://oceantoday.noaa.gov/deepoceanvolcanoes/
J [j] Read paper titled “Underwater thermal activities– an overlooked factor in climate change https://www.academia.edu/45639543/Underwater_thermal_activities_an_overlooked_factor_in_climate_change.
And article “tracking down hydrothermal vents” https://schmidtocean.org/cruise-log-post/tracking-down-hydrothermal-vents/. Also, read the report on volcanic activities under the ice sheets in Greenland and Antarctica, https://naturalworldisasters.com/antarctica-volcanoes/ and https://phys.org/news/2020-12-newly-greenland-plume-thermal-arctic.html. Read the article “Scientists Discover 91 Volcanoes in Antarctica” Scientists Discover 91 Volcanoes in Antarctica
K [k] See the article “Greenland‘s ice is melting from the bottom up — and far faster than previously thought, study” by Isabelle Jani-Friend, CNN, February 22, 2022
https://www.cnn.com/2022/02/22/world/greenland-ice-melting-sea-level-rise-climate-intl-scli-scn/index.html
L [l] See articles, https://en.wikipedia.org/wiki/Axial_Seamount and https://www.academia.edu/49442870/The_Axial_Seamount_Nature_s_Response_To_500_Years_of_Cooling
MN[m, n]] Figure-5 chart from the Smithsonian Institute https://volcano.si.edu/faq/index.cfm?question=historicalactivity.
[O][o] See the book by Peter Langdon Ward. “What Really Causes Global Warming.” And his detailed video presentation https://www.youtube.com/watch?v=FPH7HPaNHTg&t=1922s
[P][p] See the paper “Planetary Core and Surface Temperatures.” https://www.linkedin.com/posts/douglas-cotton-b794a871_planetary-core-and-surface-temperatures-activity-6607066373015379968-WcRW/
[Q][q] See the paper “New Insights on the Physical Nature of the Atmospheric Greenhouse Effect Deduced from an Empirical Planetary Temperature Model.” New Insights on the Physical Nature of the Atmospheric Greenhouse Effect Deduced from an Empirical Planetary Temperature Model
Authors
CFACT Senior Science Analyst Jay Lehr has authored more than 1,000 magazine and journal articles and 36 books. Jay’s new book A Hitchhikers Journey Through Climate Change written with Teri Ciccone is now available on Kindle and Amazon.
Robert Lyman is an economist with 37 years of service to the Canadian government.
From cfact.org