
Unplugging the Third Rail: Choices for Affordable Medicare
By John F. Early
ASSOCIATED MULTIMEDIA
Medicare expenditures as a share of gross domestic product (GDP) are now six times larger than they were in 1967. Forecasts for the next 75 years show that almost $1 of every $5 of GDP could be spent on Medicare. That is unaffordable. Without intervention, Medicare’s share of GDP will force some combination of substantial cuts in other government spending, significantly higher taxes, and unhealthy levels of public debt.
There are many policy issues concerning maintaining or redesigning Medicare. This paper looks only at the question of affordability. It identifies the minimum changes required to prevent further expansion of Medicare’s share of GDP, while retaining the existing structure of the program.
Three modifications can be phased in to meet that objective. About 41 percent of the required savings can be achieved by slowly raising the program’s eligibility age and by restoring the original criteria for disability benefits. The eligibility age could first be harmonized with the rising age for full retirement benefits from Social Security and then continue to increase consistent with rising life expectancy.
The remaining savings would require more cost sharing by beneficiaries. The first steps would be to increase deductibles and coinsurance to values that are typical for commercial insurance among the working population. Further increases would be required after another 30 to 50 years. These changes may seem large, but changes such as these are necessary to undo the substantial problem that history has given us. The good news is that if we begin soon, the changes can be made gradually, and current beneficiaries would face no benefit reductions.
Downloads
Introduction
In 2016, Medicare spending constituted 3.64 percent of GDP. That is a six fold increase since 1967, the first year after the Medicare program began operation. However, Medicare growth will not stop at this current level; long-range projections estimate that it would grow to between 9.00 percent and 19.79 percent of GDP by 2091 (see Appendix A for sources and analysis of alternative forecasts). Many factors contributing to the past and projected increases have no inherent stopping points, so Medicare’s rising burden could continue indefinitely.
This situation is not sustainable. As Medicare grows relative to GDP, it will necessarily create some combination of crowding out of other government expenditures, rising taxes, and increasing debt. At some point higher taxes will slow the economy and more debt will lead to higher interest rates, resulting in a vicious cycle of slower economic growth, exploding government debt, and perhaps even government default.
The magnitudes of these Medicare spending effects are substantial. Funding the increase exclusively by cutting other federal spending would require across-the-board reductions by the end of the 75-year forecast horizon of between 30.45 percent and 91.76 percent in other entitlement programs, such as Social Security, as well as in discretionary spending (see Appendix B for details on required spending reductions). Funding the increase exclusively through higher taxes would require hikes of between 17.35 percent and 36.33 percent across all taxes: personal income, payroll, corporate income, and others (see Appendix C for details on required tax increases). Funding the increase exclusively through debt would raise federal public debt from the current 77.53 percent of GDP to the level of current Greek debt (181.9 percent) within 13 to 18 years—assuming the rest of the federal spending and revenues continue their same relationships to GDP (see Appendix D for details on debt growth). If policymakers were to try to cover Medicare’s cost growth by spreading the financing equally across these three revenue sources, that would still require spending cuts to other federal programs of between 10.15 and 30.59 percent, simultaneous tax increases of between 5.79 to 12.11 percent, and it would only delay reaching Greek debt levels by a mere 4–10 years.
These effects apply regardless of one’s view on whether governments should subsidize health insurance, whether healthcare is a right, or whether Medicare has good or bad effects on health, redistribution, or efficiency. Unaffordability must be addressed irrespective of how one sees these other issues.
A crucial question is, therefore, how the United States can slow the growth of Medicare. This is not an issue of how to finance Medicare; if expenditure increases faster than GDP grows, no financing system can pay for it.
I therefore consider what changes in Medicare’s parameters might reduce its growth rate relative to the overall economy. These changes take the program’s current structure as given but adjust key features that affect the level and growth rate of expenditure. The factors assessed include the age of eligibility, the criteria for disability under Social Security that guarantees Medicare coverage, and the sizes of deductibles and coinsurance.
My analysis shows that there are combinations of these three adjustments that can reduce Medicare expenditure growth to a rate consistent with the long-term historical growth rate of GDP. If future GDP growth continues to approximate recent history, Medicare would then remain stable as a percentage of the economy. These changes would not resolve the controversies over Medicare; it would still generate numerous distortions in healthcare markets and require substantial distorting taxation. But a Medicare program that does not bankrupt the economy is far better than one that does.
Quantifying the Causes of Historical Medicare Trends
The expansion in Medicare’s share of GDP from 1967 to 2016 resulted from three general trends: growth of the senior population, healthcare prices rising faster than overall inflation, and policy changes that enlarged coverage. Figure 1 shows the contribution of each trend and some more granular causes within them. Among those causes:
- Population growth is the rate at which new beneficiaries reached the eligibility age of 65. It grew at an average annual rate of 1.2 percent from the inception of Medicare and added 0.06 percent of GDP to the cost of Medicare. 1
- Increased longevity added more years of Medicare coverage for each beneficiary. In 1967, the original Medicare beneficiaries, at eligibility age 65, had an average life expectancy of 14.8 years. By 2017, life expectancy had risen an additional 4.5 years, boosting the number of people receiving benefits by 30.4 percent and, thereby, consuming an additional 0.61 percent of GDP. 2
- Aging captures the effects of the average beneficiary being older and requiring more care. The net effect of aging was to raise Medicare expenditures by only 0.11 percent of GDP because improvements in health and care modalities have significantly reduced the cost of care for older beneficiaries. 3
- Relative price inflation reflects medical inflation being higher, on average, than general inflation, which increased Medicare’s share of GDP by 0.42 percentage points.
- Disabled and end-stage renal disease (ESRD) patients were added to Medicare coverage in 1973 and account for an additional 0.25 percent of GDP.
- Weaker disability criteria have been adopted by the Social Security Administration since disability coverage began in 1972. As a result, despite better medical care mitigating many disabilities, declining on-the-job injuries, and the new Americans with Disabilities Act requiring employer accommodations for disabled workers, the granting of Medicare disability benefits more than tripled from 1.41 percent of the working-age population to 5.17 percent (see Appendix E for fuller details on the changes and their consequences). 4 The additional beneficiaries from these weakened regulations constitute the largest single source of Medicare’s increased expenditures—an additional 0.66 percent of GDP.
- Drug benefits were added in 2006, increasing Medicare’s share of GDP by 0.38 percentage points.
- Increased consumption of medical services per beneficiary beyond the added drug benefit accounted for nearly one-fifth of Medicare’s greater resource utilization, rising more than six fold and consuming an additional 0.61 percent of GDP. Some of these increases were legislated, such as the addition of 60 days of lifetime in-patient care (1967); liver transplants (1985); unlimited home health services and detoxification services (1980); and expanded coverage of podiatrists and orthotic shoe manufacturers (2014). 5 Most of the explicit expansions, however, came from hundreds of administrative additions such as electric wheel chairs, expanded joint replacements, and orthopedic braces.
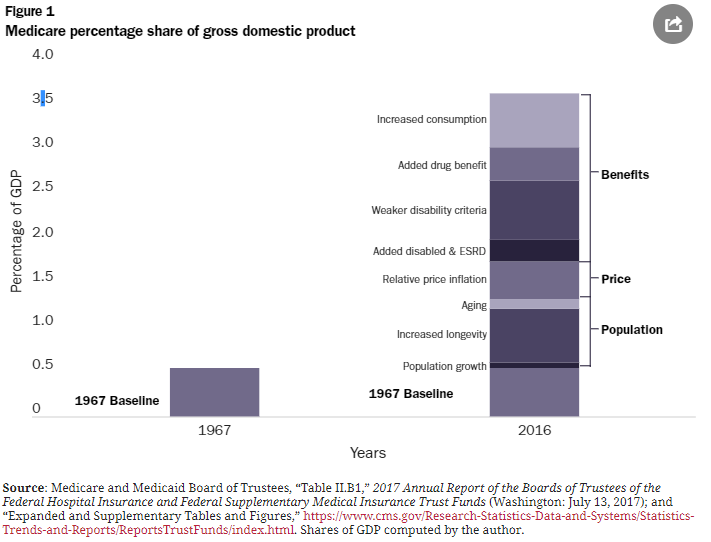
Source: Medicare and Medicaid Board of Trustees, “Table II.B1,” 2017 Annual Report of the Boards of Trustees of the Federal Hospital Insurance and Federal Supplementary Medical Insurance Trust Funds (Washington: July 13, 2017); and “Expanded and Supplementary Tables and Figures,” https://www.cms.gov/Research-Statistics-Data-and-Systems/Statistics-Trends-and-Reports/ReportsTrustFunds/index.html. Shares of GDP computed by the author.
At least as important in generating greater consumption were the steep drops in the share of the cost paid by beneficiaries. In Medicare’s first years, beneficiaries had to meet deductibles equal to 44 percent of their average benefit, but by 2016 deductibles were a mere 14 percent of the benefit. The deductible for medical benefits (Part B) in real dollars fell by more than half. 6 On top of those general cost-sharing reductions, beginning in 1989 four new programs started to pay all premiums, deductibles, and coinsurance for about 20 percent of beneficiaries with lower-incomes, cutting their marginal cost for healthcare to zero. 7
Potential Policy Adjustments
Three types of policy adjustments could slow Medicare’s unsustainable expenditure increase without substantial modification to the program’s general structure. The following analysis evaluates the ability of each of these adjustments to limit the increase in Medicare’s share of GDP at several different levels of implementation. I consider the effect of each selected change by itself on the share of GDP at the end of the forecast period, then look at the contributions of selected combinations of all three, and finally identify some phase-in strategies, since immediate implementation of the full adjustments would not be necessary from the expenditure perspective and might be unnecessarily disruptive.
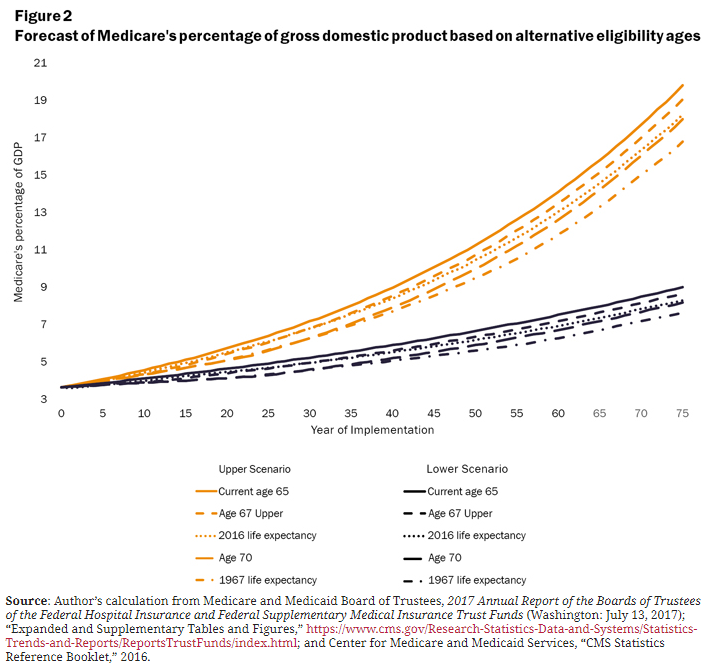
Raise the eligibility age
Despite substantially greater longevity, the eligibility age for Medicare has remained at 65 since inception. Social Security eligibility for full benefits, by contrast, is slowly being raised to age 67 by 2027. Harmonizing Medicare’s eligibility age with Social Security’s would be a minimal appropriate adjustment. 8
A second alternative would begin increasing the eligibility age on a continuing basis to keep life expectancy at the eligibility age the same as it was in 2016 (19.6 years). This approach would initially raise the age more slowly than the move to age 67 by 2027, but the increase in eligibility age would continue for the entire forecast period, reaching 69 years, 3 months, by the end of the forecast period and ultimately saving more money.
A third possibility would be to adopt a higher fixed eligibility age of 70. With a phase-in rate similar to the one used in the first option to raise the eligibility age to 67, Medicare’s eligibility age would reach age 70 in 2039 and remain at that age thereafter.
Finally, the eligibility age could be set to give the same expected number of years of coverage as the original Medicare plan: 14.78 years for the typical beneficiary. This higher eligibility age could phase in at the same rate as the age-70 design. After the eligibility age reached age 70, if it continued to rise at the same rate it would reach the target of 14.78 expected years of benefits with an eligibility age of 73 in 2072 and then rise more slowly, maintaining the average expectancy of 14.78 years. Current demographic forecasts point to an eligibility age of approximately 74 by 2091.
As the eligibility age increases, some individuals between age 65 and the new eligibility age would continue on their previous disability status until they reached the new age, and others would likely be granted new Social Security disability benefits and, thus, be added to Medicare as disabled individuals. The results presented here incorporate estimates of those offsetting effects using reported levels of disability among older cohorts in the Current Population Survey to extend the observed Medicare under-age-65 disability rates to individuals above age 65.
Figure 2 illustrates the reduction in Medicare’s share of GDP created by each of the four alternative phased-in modifications to eligibility age. The most powerful age adjustment, which restores the 1967 life-expectancy criterion, would slow the future growth of Medicare’s GDP share by 25.55 percent for the upper scenario by the end of the forecast period and by 18.65 percent under the lower scenario. By itself, that age intervention has only moderate effects, but it could still make a significant contribution as part of multifactor approach.
Restore disability criteria
Procedures for granting Social Security disability benefits have been systematically weakened since 1973. 9 For example, despite the statutory requirement that beneficiaries must be “unable to work any job in the national economy,” beneficiaries are now allowed to earn $13,000 per year without any reduction in their benefits. 10 That would be equivalent to a full-time 35-hour week, year-round job at minimum wage. So, some beneficiaries can and do work, but choose not to work enough to lose some of their benefits.
Administrative procedures have also been changed to bias benefit determinations in favor of the claimant. First, the administrative law judges in the Social Security Administration are required to give greater weight to the opinions of the practitioners hired by the applicant than to the judgment of the government’s own experts. 11 Second, a person can combine two or more nondisabling conditions to claim a benefit even though the combined demonstrable effect of both conditions still does not actually prevent them from working. Third, applicants are not required to complete a course of remedial therapy that would allow them to regain some or all of their lost function. Other countries have introduced reforms that require applicants to develop a rehabilitation plan for returning to work with an employer and to demonstrate that they have followed through on it before being approved for disability payments. In the Netherlands, this approach, combined with employer accommodation reforms, reduced newly approved cases by 60 percent. 12
Once people are on taxpayer-financed disability benefits, they almost never admit to recovery and take up productive work. Less than 1 percent of beneficiaries ever leave the program to return to work, yet research by Till von Wachter of the University of California, Los Angeles, suggests that at least half of those in the 30–44 age group could, in fact, return to work if they were required to do so. 13
As a result of degraded procedures and criteria, the percentage of the working-age population receiving disability benefits under Medicare has more than trebled. Reinstating statutory eligibility criteria could reduce the increase in Medicare’s share of GDP by between 15.88 percent at the lower boundary and 22.41 percent at the upper boundary. 14 Making these changes in disability criteria would also create significant savings for Social Security, but those have not been incorporated here.
Increased cost sharing
True medical insurance would pay for high-cost, low-probability events such as heart surgery or a regimen of medication to cure hepatitis C. Routine care, such as wellness check-ups, vaccines, screening tests, treatments for the occasional upper respiratory infection, treatments for osteoarthritis, and even uncomplicated cataract surgery would not be insurable events because they are predictably likely and not exceptionally expensive.
Before Medicare, most medical insurance was protection against catastrophic medical events. Original Medicare reflected that type of arrangement, with deductibles equal to 44 percent of the total benefits, compared with only 14 percent today. This sharp decline in cost sharing reflects three trends. First, government began to promote and mandate so-called Health Maintenance Organizations (HMOs) in the non-senior market that covered almost everything with minimal cost sharing. The putative tradeoff was that these HMOs could limit utilization and control costs better with a variety of managed-care techniques. The richer coverage became the widely accepted norm and was likewise added to Medicare, but without the cost control of managed care. Second, both state and federal governments mandated literally thousands of items that must be covered by insurance. While these regulations did not directly apply to Medicare, their intent was largely adopted for Medicare. Third, because Medicare was taxpayer-funded, lawmakers were not subject to market restraints and responded to political pressure that added benefits without countervailing cost controls.
A minimum starting point for reforming Medicare cost sharing would be to require at least as much financial responsibility from its beneficiaries as from the working population. In 2016, the average deductible for private-employer single plans was $1,505, which was 17 percent lower than the $1,814 sum of the deductibles for all three Medicare parts. 15 This comparison, however, suggests a deceptive similarity. Medicare has three separate deductibles: $1,288 for hospitalization, $166 for medical, and $360 maximum for drugs (zero in many plans). 16 The private-sector average deductible applies to the sum of all three expenditure types: hospitalization, medical, and drugs.
Only 12 percent of Medicare beneficiaries have an episode of hospital care each year, so for 88 percent of the beneficiaries their effective limit on unsubsidized care is only $166. Compare that to the average for single beneficiaries in private employer plans of $1,505—9 times more. High-deductible plans are the fastest-growing type of employer plan and are offered by two-thirds of large employers. Their deductibles average $2,304, or 14 times Medicare’s $166. 17 The trend is for more of these plans to stipulate $3,000 deductibles, which is 18 times Medicare’s rate.
Medicare’s 20 percent coinsurance appears to be in line with typical private insurance provisions for in-network providers that have demonstrated high quality at lower total cost per episode of care. Depending on the type of plan, private coverage outside the limited network is either nonexistent or at coinsurance rates of 40–50 percent. Although there is a suggestive similarity between in-network coverage and the set of doctors accepting Medicare assignment, the analogy is a poor one.
First, many physicians outside of highly affluent practices continue treating their patients once they reach age 65 out of a social, professional, or moral commitment to them, despite receiving lower fees. Second, Medicare’s monopsony within the senior market is so strong that few physicians—and virtually no hospitals—can resist its power. Third, beyond the sheer market power, government has prohibited physicians and hospitals from treating both patients under Medicare and eligible senior patients outside of Medicare. If a private insurer required its in-network physicians to treat only its beneficiaries, state insurance regulators would pursue them under the network sufficiency and any-willing-provider regulations. Antitrust litigators would also likely follow. 18 As a result, seniors have virtually unlimited provider access at a nominal in-network coinsurance.
Finally, Medicare’s coinsurance percentage is applied to Medicare’s government-enforced provider fee for the service. Private coinsurance percentages are applied to the contracted physician fee for in-network care and to the usual and customary charges for out-of-network care. 19 In-network fees average 79 percent higher than the corresponding Medicare fees, so Medicare’s 20 percent coinsurance is applied to a lower fee, resulting in a substantially lower out-of-pocket cost for the same service. 20 To make Medicare’s coinsurance equivalent to the in-network coinsurance dollar amount for the working insured, the Medicare coinsurance rate would need to be approximately 36 percent.
Beginning in 2011, Medicare eliminated all deductible and coinsurance requirements for a set of preventive health examinations and tests. Making these services free was justified as saving money by preventing costly diseases, although the evidence of actual savings is, at best, debatable for such across-the-board interventions. 21 This change reduced further the financial incentives for prudent consumption.
The substantial divergence of Medicare cost sharing from industry standard practices is both a cause for its out-of-control expenditures and a significant opportunity to regain control. Making Medicare cost sharing more like industry standard practices has two benefits. First, the beneficiaries pay a greater portion of the total expenditure and taxpayers pay less. Second, because they must spend some of their own cash, beneficiaries will be more efficient in their use of care, consuming somewhat less overall. This analysis estimates the sensitivity of beneficiary spending to the cost sharing they must pay by using the conservative lower end of such estimates from the economics literature. 22
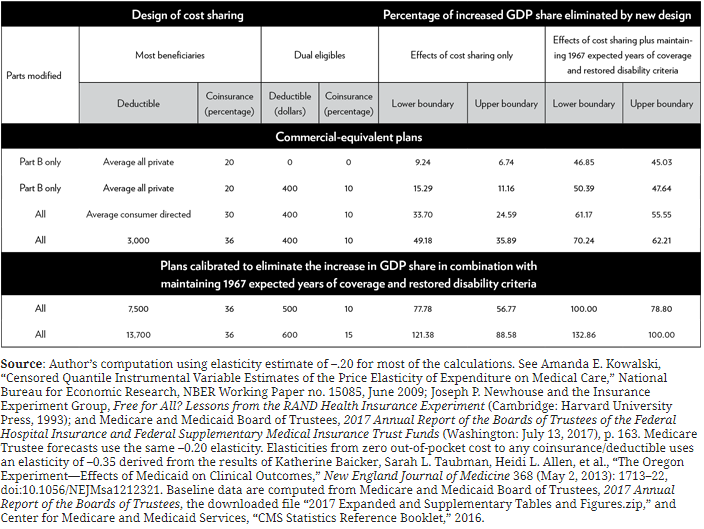
Table 1 shows a range of plausible alternative plan designs that bring Medicare cost-sharing closer to that for the working insured. Each of these alternatives replaces the generous Part B deductible with one of three typical private-plan deductibles: the average of all plans, the average of consumer-directed plans, or the leading-edge $3,000 deductible. None have any first-dollar coverage. The “all parts” plans apply a unified deductible to all expenses and do not exempt the first 60 days of a hospital stay from coinsurance. The first two plan designs are the same with the exception that the first one continues the practice of zero cost sharing for dual-eligible beneficiaries, while the second adds a modest deductible and coinsurance, as do the other examples.
Table 1
Alternative cost-sharing plan designs for Medicare, consistent with commercial insurance
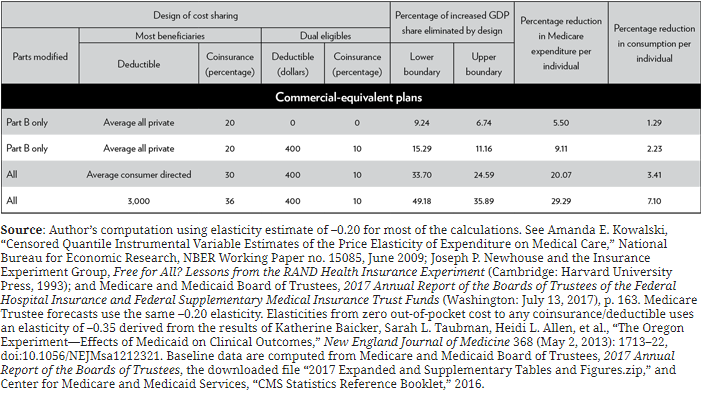
The addition of the dual-eligible cost-sharing strengthens the effect of the first policy option by almost two-thirds, increasing the savings from 9.24 percent to 15.29 percent at the lower boundary and from 6.74 percent to 11.16 percent at the upper boundary. Advocates for the current policy justify zero deductibles and coinsurance for dual-eligible beneficiaries on the basis of their poverty. But with no financial stake in the transaction, they have no financial incentive to restrain consumption and they consume 2.27 times more per capita than Medicare-only beneficiaries. 23 Advocates correctly note that the dual-eligible population is also sicker than the rest, but after an adjustment for health status the dual-eligible population still spends 42.42 percent more per capita than its difference in health status would predict. 24
Giving lower-income beneficiaries totally free care incentivizes consumption of healthcare for which costs exceed benefits. Even modest copays and deductibles will help limit their consumption to the necessary services because they must make at least some tradeoffs in how they spend their money. Giving poor seniors smaller premiums and maximum out-of-pocket limits can provide similar economic relief without eliminating all incentives to conserve.
The highest cost sharing for the leading edge of commercial-equivalent plans would mitigate the increase in the GDP share for 2091 by between 35.89 percent and 49.18 percent. Medicare expenditures per person would be cut by 29.29 percent, but individual consumption would be reduced by only 7.10 percent, with beneficiaries paying the difference.
Reduced consumption does not necessarily diminish the effectiveness of care. Several studies have concluded that one-quarter or more of the expenditures on medical care in the United States makes little or no significant contribution to improved health status. 25 Of course, when consumers cut back, they do not necessarily eliminate the items that expert panels would consider excessive, and indeed studies have found that spending reductions from higher copays are divided roughly proportionately between those items the expert analysts believe are beneficial and those they don’t. 26 Proportionate noncompliance with expert panels is not necessarily bad. Even if panel consensus is sustained over time, individual patients may benefit from contrary decisions that they reach with their personal physicians. Patients, physicians, and insurers will continue to benefit from research on medical outcomes of different treatments, but the costs of these individual decisions are most appropriately borne, at least in part, by the individual who putatively gets the benefit, not entirely by the taxpayer, who does not generally benefit.
Cumulative effects of multiple interventions
Each of the three interventions examined so far offers significant improvements in the Medicare expenditure burden on GDP, but no single one is sufficient to overcome the entire problem. Since both the higher eligibility age and reinstated disability criteria ease the flow of individuals into the program, calculating their combined effect is relatively straightforward. Implementing both the eligibility age based on the 1967 years of benefits and the restored disability criteria would reduce the forecast GDP share for Medicare from the range between 9.00 and 19.79 percent of GDP to the range between 5.24 and 9.74 percent, removing about 41 percent of the problem across the range of the forecast.
Combining the market-based $3,000 deductible plan design with the other two interventions eliminates between 62.21 and 70.24 percent of the total problem and lowers the forecast range to between 5.24 and 9.74 percent of GDP. 27
Table 2 adds the cumulative effects of all three interventions for each cost-share design and provides two more plan designs that have been calculated to reduce expenditures sufficiently to avoid the entire increased GDP share when combined with the increased eligibility age and restored disability criteria. As one would expect, the plan designed to avoid the expenditure increases under the upper-boundary scenario would create a surplus if the lower boundary obtained; the 132.86 percent reduction is consistent with that expectation.
Table 2
Alternative cost-sharing Medicare designs to mitigate excess expenditures fully
Phasing in
While one might configure the details differently, any plausible options to avoid the unsustainable rise in Medicare expenditures by adjusting only values of its existing design parameters would require significant changes in the benefit package similar to those for the last two designs in Table 2. The required changes may appear to be large, but we must recall that the problem is very large and has been created over decades. It now needs to be unwound. Fortunately, if we do not delay too long, the changes can be phased in on a schedule that will avoid sudden large changes for individual beneficiaries and provide time for them to adapt.
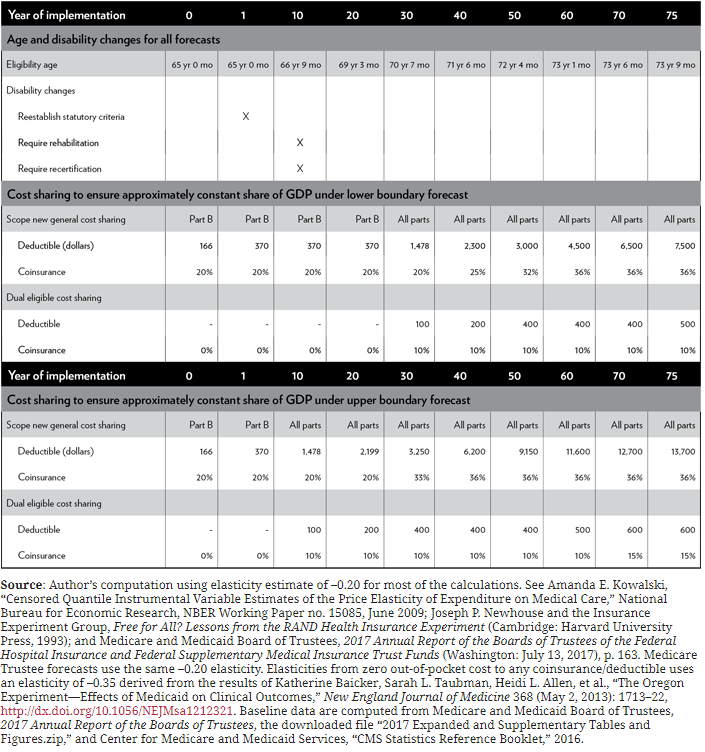
About 41 percent of the problem can be solved by gradually raising the eligibility age to provide only the original expected number of years of coverage and returning to the original statutory requirements for disability. A similar gradual age increase has already been instituted for Social Security and it seems to have been tolerated well. No beneficiary will be required to give back any benefits on account of this change. In order to restrain Medicare’s GDP share to its current level, the eligibility age would continue to rise beyond the currently planned Social Security level, but never at a faster rate. Once the 1967 expected years are achieved, the age could rise more slowly to maintain the same expected number of years of retirement. This approach gives individuals plenty of time for planning and it reduces the current burden for younger cohorts funding longer-than-promised retirements for their elders.
Most of the disability reform involves not providing benefits to people who fail to meet the statutory “unable to work at any job in the economy” criterion. Unfortunately, over time, program officials and administrative law judges have increasingly overlooked this criterion when making regulations and benefit decisions, as I explain in Appendix E. If this criterion were reasserted, the only time that existing beneficiaries would be affected is when they fail to pass recertification of their disability under the original criteria.
Irrespective of which forecast path Medicare follows, the revised eligibility ages should be implemented immediately. The disability criteria should be immediately returned to their original forms and be quickly supported by requirements for appropriate rehabilitation and periodic audits.
If we are lucky and the lower-boundary forecast obtains, then fixing the age and disability criteria will eliminate most of the rise in Medicare’s share of GDP for the next 30 years, requiring only modest increases in cost sharing to close the remaining gap. To keep the GDP share stable, standard deductibles for Part B would increase from $166 to $370 over an initial period of 20 years and then rise to the average commercial level of $1,478 for the combined three parts over the next 10 years. Coinsurance would remain at 20 percent. No cost sharing would be added for dual-eligible beneficiaries until year 30, when a $100 deductible and 10 percent coinsurance would begin.
Even under the upper-boundary conditions, the first 10 years would also need relatively modest increases in cost sharing. By year 10, the deductible would need to rise to the average commercial deductible of $1,478 across all three parts while retaining a 20 percent coinsurance, and a $100 deductible with 10 percent coinsurance would begin for dual-eligible beneficiaries.
After 30 years under the lower-bound projection or 10 years under the upper-bound projection, cost sharing would then need to rise systematically every year. Under the lower boundary conditions, by the end of the forecast period standard deductibles and coinsurance would reach $7,500 and 36 percent, with $500 and 10 percent for dual eligible beneficiaries. At the upper boundary, they would become, respectively, $13,700 with 36 percent and $600 with 15 percent. See Figure 3 for one configuration to phase in cost sharing that would keep Medicare’s GDP share roughly stable. See Appendix F for more details.
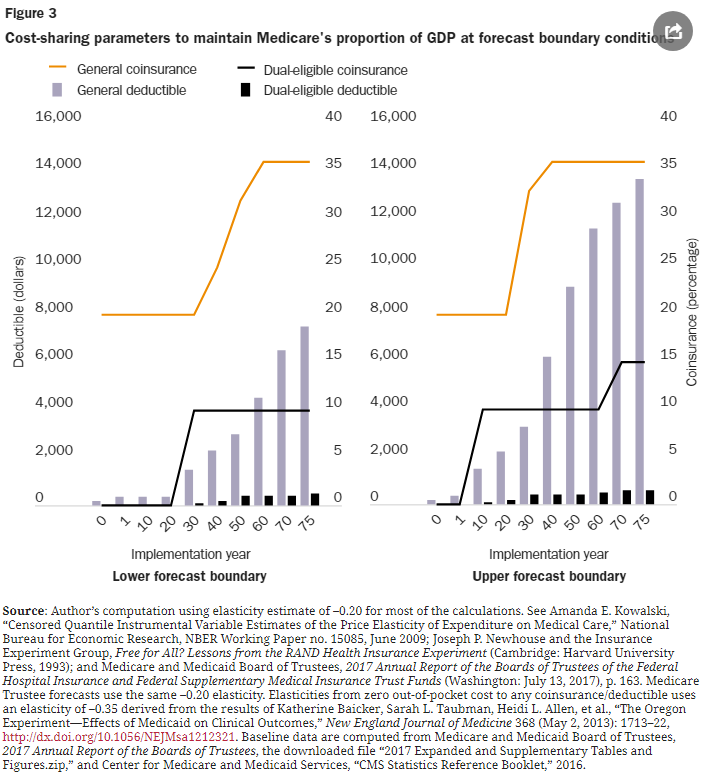
Note: In combination with phased increases in eligibility age to achieve the same expected years of coverage as in 1967 and returning disability criteria to their original forms, the above cost-sharing arrangements will prevent increases in Medicare’s share of GDP across the 75-year forecast horizon at the lower and upper forecast boundaries, respectively.
Policymakers have been reluctant to make any changes that look like benefit reductions. They have also failed to confront the unsustainable growth in spending. The initial age and disability changes proposed here would not reduce any current beneficiary’s benefits; they simply return the number of years of coverage and the need for disability coverage to their original intents for new beneficiaries. If policymakers wish to retain the structure of the current Medicare program, changes similar to those identified here are required to avoid the negative consequences of the unsustainable increases in Medicare expenditures. They will need to make necessary immediate changes, which will delay the onset of adverse economic effects. They can then use that delay to engage each other and the public on the reality of the current affordability threats and the need to raise cost sharing. If the increases in cost sharing identified here are not acceptable, then policymakers need to explore other, more creative changes to the overall structure—topics beyond the scope of the current paper. They might also reach a consensus on a slightly higher level of spending as being appropriate, but that new target would still need to be firm and well below the uncontrolled consequences of the current arrangements.
Conclusion
Medicare spending was accelerated by a political process that added beneficiary populations and expanded individual benefits. As a result, Medicare’s financial burden on the economy has risen more than six-fold, from 0.55 percent of GDP to 3.64 percent. Without significant interventions, the government expenditure for senior medical care is forecast to rise by more than a factor of five: from 3.64 percent of GDP to as much as 19.79 percent. This greater resource burden can only result in some combination of deep spending cuts in both discretionary and entitlement spending, sharp tax increases, and a hazardous debt burden. Higher taxes and debt would slow economic growth and reduce our standard of living.
The rapid increases in Medicare expenditures have also driven up demand, and hence prices, for medical services generally. Those higher prices have been paid by working consumers and also created higher government expenditures for programs such as Medicaid and Affordable Care Act coverage. Keeping Medicare expenditures at a stable proportion of GDP will help moderate those costs as well.
This excessive government consumption could be moderated by plausible combinations of strong interventions to delay the eligibility age consistent with increased longevity, restore disability criteria, and increase beneficiary cost sharing. Policymakers may feel that these adjustments are too large, but if they wish to preserve the current general program design, some combination of similar adjustments is required to prevent financial collapse and deterioration in economic growth and our standard of living.
Appendix A: Alternative forecasts of Medicare expenditures
From 1967 to 2016, total federal expenditures rose to 22.5 percent of GDP and federal public debt to 77.5 percent of GDP. Medicare accounted for more than that entire increase in expenditures. 28 The Medicare growth rate in inflation-adjusted dollars has slowed to 4.30 percent in the last 20 years, but it is still rising faster than GDP and government revenues. It is rapidly becoming unaffordable, consuming ever-larger proportions of our economic value and jacking up the nation’s debt burden.
This paper uses two bounding 75-year scenarios to forecast Medicare financial effects in the absence of policy changes: one at its likely upper bound and a second at its likely lower bound. Table A-1 shows how these two bounds fit within a range of forecasts based on historical periods and official government estimates.
At the high end of the forecasts, the full-history trend is unlikely to repeat because:
- Almost all the future covered senior population has already been born, and we know it will grow more slowly.
- There are fewer major opportunities to expand coverage. Dental, hearing, and vision might be added, but even in aggregate they are smaller than drug coverage.
- Inflation differentials between medical and general prices are running only about one-third as large as they were during the first 30 years of Medicare and are generally decelerating.
The lowest forecast, published by the Medicare Board of Trustees, is unlikely because it assumes:
- New price controls on hospitals and doctors will be more effective than the historical failures of similar schemes. For instance, the infamous “sustainable growth rate” was repeatedly suspended by the “temporary doc-fix” every year for 16 years before it was repealed. The Medicare Board of Trustees itself discounts the dependability of such an effort in the future. 29
- Reduced intensity and demand for medical service—not just a slowing, but a full reversal of the historical trend of rising demand, which has in all other times and places accompanied greater prosperity and scientific advances. 30
- An implicit 32 percent decline in the covered disabled population, with no justification or policy change to effectuate the reversal.
Appendix B: Federal spending reductions required to fund Medicare expenditure growth
Medicare expenditures are forecast to grow from 3.64 percent of GDP in 2016 to between 9.00 percent and 19.79 percent by 2091, an increase of between 2.47 and 5.43 times the current level for the lower- and upper-limit scenarios, respectively. Both are unsustainable levels of resource consumption for a single government transfer program. Figure A-1 shows these forecast percentages of GDP in comparison with 1967, 2016, 2036, and the point at which expenditures double. The figure also shows the percentages of GDP that were spent for major components of consumption, investment, and government in 2016. Any rise in Medicare’s share of GDP will force a reduction in the share of some or all other expenditure categories. Figure A-1 shows what those reductions would look like if they were applied pro rata to each category. While exactly proportionate reductions are unlikely, the chart demonstrates the magnitude of the average effects that would occur. Illustrative examples of the problem include:
- In 1967, Medicare expenditures were smaller than those for any major national income category.
- By 2016, they were almost as large as the spending on national defense, or on residential construction, or on elementary and secondary education. That means Medicare is competing for resources with two major government activities and one of the key drivers of economic growth. Beyond that, Medicare exceeded each of the following economy-wide expenditures by significant margins:
- investment in industrial plants and business buildings
- consumption by the entire population of
- home utilities
- recreational services
- motor vehicles
- transportation services
- apparel
- recreation goods
- home furnishings and appliances
- motor fuels
- other durable goods
- government spending for
- state and local social services
- public order and safety
- federal social services other than Medicare and Social Security
- highways
- infrastructure other than highways
- higher education
- In 20 years, Medicare expenditures will exceed investment in industrial equipment and business machinery or in intellectual property. They will be larger than the consumption of financial services, food and beverage at home, or food and lodging away from home. Finally, Medicare spending will pass that of Social Security in a mere 14 years.
- If the lower-limit scenario holds, Medicare spending will surpass spending for shelter and leave consumer medical spending as the only category exceeding Medicare.
- Within the forecast range, Medicare is 90 percent likely to surpass consumer medical spending.

If Medicare’s spending remains unchanged, reductions in the GDP share for some or all other public and private expenditures will be inevitable because the increased expenditures can be funded with spending cuts, tax increases, or larger debt, each with adverse practical effects on individuals.
To fund Medicare exclusively from cuts in other federal spending would require across-the-board reductions of between 30.44 percent and 91.75 percent in both other entitlement and discretionary spending. 31 If any functions such as Social Security, Medicaid, food stamps, or national defense were exempted from some or all of the cuts, other functions would need even deeper cuts. The upper-boundary scenario would allow funding only for about 90 percent of the current relative resources of Social Security, national defense, and public safety—and nothing else, including no non-senior safety net. While some reduction in federal spending might be desirable, simply spending more on Medicare and offsetting it with smaller amounts on other services would not reduce the size of government spending. Many people would also object to the sharp reductions required to achieve the offsets.
Appendix C: Federal tax increases required to fund Medicare expenditure growth
If the Medicare spending increase were to be funded totally through taxes, on average all federal taxes—personal income, payroll, corporate income, and others—would need to be raised by between 17.36 percent and 36.33 percent over the forecast period. The Medicare Board of Trustees estimates that an increase in the Medicare payroll tax of 0.64 percentage points to 3.54 percent would avoid depleting the funding balance projected for Part A in 2029. 32 But Part A payroll taxes and funding balances are only a small part of total Medicare, so even if this payroll tax were passed, additional tax increases averaging between 15.41 percent and 34.06 percent would be needed to cover all of the spending increases.
Higher individual taxes would lower Americans’ standard of living and reduce savings for investment. Higher business taxes would cut investment in plant, equipment, and intellectual property, thereby slowing growth and further eroding the individual standard of living. Slower growth would also mean a smaller GDP, which would translate into a still larger proportion of GDP being consumed by Medicare, further exacerbating the negative effects.
Appendix D: Public debt growth generated by Medicare expenditure growth
During the last three decades, debt has been the primary funding mechanism for increases in Medicare spending. General revenue was allocated under permanent entitlement appropriations without any public attention or vote, and the Treasury simply borrowed what it needed to write the checks to Medicare. Continuing to follow this prescription would raise federal public debt from the current 77.53 percent of GDP to the level of current Greek debt (181.9 percent) within just 13 to 18 years. 33
Projecting the exact timing and mode of financial distress from such high levels of debt would be difficult, but one can be reasonably certain that without policy changes to Medicare we are about one decade from significant financial turmoil. This is long before the end-of-forecast period, which would bring federal public debt to between 1,056.21 percent and 3,363.38 percent of total GDP.
Well short of the catastrophic levels, the added debt would absorb more of the available savings, leaving less for investment in productive capacity. Because the pool of investable funds would be smaller, the market interest rate would be driven higher and make investments more expensive. If there are fewer savings for investment and investment costs more, we will get less capital and, therefore, less production. Less production will lower the standard of living and slow the rate of GDP growth, further increasing the adverse effects of Medicare spending.
Appendix E: Factors creating Social Security disability criteria
Government payment to people claiming disability has been one of the fastest and largest drivers of disproportionate increases in transfer payments. Very recent data show a modest reversal of the trend, owing in part to recent administrative reforms of some of the excesses documented here. These payments go only to the preretirement population. Since the largest federal disability benefit program is run by the Social Security Administration, it is often lumped in with the Old-Age and Survivors Insurance (OASI) Social Security benefits paid based on earnings up until retirement, but the two programs are related only in that they are funded by the same payroll tax (although in law they each have an assigned portion of the total) and that the Social Security Administration runs both of them.
Disability beneficiaries are also entitled to free Medicare, so a portion of the Medicare taxes also go to pay for Medicare for the disabled.
The facts of excessive payments
The facts behind the rapid rise in government disability benefits, including through Medicare, are as follows:
- The number of people receiving government disability benefits is growing more than 5.4 times faster than the population.
- The Census Bureau’s Current Population Survey asks whether respondents have a “work-limiting disability.” In 2014, 5.4 percent of people aged 35–44 reported that they did have such a limitation. That is slightly less than the 5.6 percent who reported such a limitation in 1984. But in that same time period government more than doubled the number of people being paid disability allowances and entitled to free Medicare. 34
- The Americans with Disabilities Act of 1990 requires that employers make reasonable accommodations to hire disabled individuals, yet the proportion of the working age population drawing disability benefits has risen.
- Workplace safety continues to improve, reducing disability on the job. 35
- Medical advances have reduced the debilitating effects of many disabilities.
- The average benefits received per beneficiary have risen 1.39 times faster than inflation from 2003 to 2012. Since the basic benefits are escalated by the Consumer Price Index, this means that in terms of actual purchasing power the benefits being awarded have grown. 36 While the size of these awards does not directly affect the Medicare costs, indirectly larger awards increase the incentive for people to seek disability classifications.
- We now have only 17 people working and paying the taxes for each person receiving Social Security disability benefits and the corresponding free Medicare, compared to more than 50 working to support a single disability beneficiary in 1975. 37
- Beneficiaries who have been found disabled and “unable to work any job in the national economy” are allowed to earn $13,000 per year without any reduction in their benefit. 38 Obviously some of them can work. They just choose not to work enough to lose their benefits. 39
Causes of rising disability roles
The above facts show that there is no reason to believe that the incidence of disability is really rising. In fact, the frequency, severity, and age of onset for most disabling conditions have been improving steadily, and the rate of industrial accidents has fallen dramatically. There are only two possible explanations for the observed increase in the frequency and magnitude of disability payments: increasing fraud by beneficiaries, and/or politicians and bureaucrats systematically liberalizing the criteria for benefits. In fact, both appear to be the case.
The U.S. Senate Permanent Subcommittee on Investigations conducted a scientific survey and evaluation of disability awards over the period 2006–2010. The report documented that at least 25 percent of applications were granted “without properly addressing insufficient, contradictory and incomplete evidence.” The legal standard for a disability finding is “being unable to work any job in the national economy.” This standard was systematically violated in the 25 percent of cases flagged by the investigation. 40
The hearings on disability claims are conducted by an examiner. If the claim is denied, it can be appealed to a second-level review. If it is denied a second time, it can be appealed to an administrative law judge. Among the examples in the report, one administrative law judge in Oklahoma City approved $1.6 billion in lifetime benefits in just three years of case review. He approved 90 percent of the 5,400 cases he reviewed, all of which had already been turned down by the initial claim examiner and by a senior reviewing examiner.
The investigation uncovered many cases in which administrative law judges simply cut and pasted copies of medical records from one report to another with no evidence of independent information or review. That is actually perjury. One administrative law judge in West Virginia was indicted for running a scam with a lawyer who would submit hundreds of cases that would be approved mechanically. Both the administrative law judge and the lawyer benefited financially. In another case, more than 70 people were arrested on fraud related to disability claims in Puerto Rico. 41
While 70 percent of the third-level reviews confirmed findings of ineligibility, 9 percent of the administrative law judges overturned the denials they reviewed more than 90 percent of the time. There was an unbelievable consistency in those individuals. The administrative law judges who overturned 90 percent or more of their assigned cases did so year after year. Since every year they would get a random set of cases, that means something either illegal or incompetent is going on. Administrative law judges who had lower reversal rates showed substantial year-to-year variation in their determinations, reflecting the different levels of merit in the cases they would get each year. This 9 percent fraction of excessively generous administrative law judges have added 98,000 extra beneficiaries to Medicare over a six-year period, at a cost of $23 billion in taxpayer money. 42
In addition to a general deterioration of standards and bad administration of the rules, there are at least five structural deficiencies that further bias the outcomes. 43
- The administrative law judge is required to advocate on behalf of the claimant, including the 85 percent of claimants who are represented by a third party. So, the same person both represents the claimant and adjudicates the dispute.
- Not only does this dual role bias the outcome, it also places additional work burdens on the administrative law judge, who must invest time in being sure the claimants have all their documentation properly prepared to present their best case. The claimants and their representatives no longer bear that responsibility. This is the third-level appeal, not the initial claim where one might reasonably expect assistance in preparing a request. No one complains if the two earlier denials are overturned because nobody is representing the taxpayer in these third-level proceedings.
- Hearing officers and administrative law judges must follow the dictates of a device for determining judgments known as the “medical vocational grid.” The grid is a bureaucratic construct, not something in the law. This framework sets out the rules for making a disability determination. It departs from the fundamental standard of “unable to work any job in the national economy” by setting looser standards for some classes of people, such as people with only a high school education. The theory is that they would have a harder time finding a job, but this whole theory stands the meaning of disability on its head.
With this grid, the criterion has shifted from whether the claimants are able to work to whether they can find a job—lots of unemployed people can’t find jobs. The criterion is supposed to be whether there are any jobs they can do. There is a big difference.
Even in the context of using some assessment of the ease of finding a job, education is used, but not experience. A high school graduate with 20 years of progressively responsible positions might actually be able to find a job more easily than a new college graduate without any work experience. Yet the grid sets looser standards for experienced workers. Finally, the grid lowers the eligibility standards for people who don’t speak English well, on the same theory that it would be harder for them to find a job. This same criterion is applied in Puerto Rico, where most business is conducted in Spanish.
- It is too easy to shop for a biased administrative law judge that is 90 percent or more likely to award the benefit. If claimants get a rigorous administrative judge assigned to their case, they can proceed and, if they lose, just file again. An easier and faster abuse is simply to withdraw the case if it is assigned to a rigorous administrative law judge and then refile it, hoping for a better draw. This abuse could easily be stopped by requiring at least five years between filings, including any that are withdrawn. Claimants would get the assigned judge and that’s it. This reform does raise the concern that people who have progressive degeneration arising from their disease or injury may hit disabled levels before their five-year wait is over. But that would be a good disincentive for filing a capricious appeal. There may be a few hardship cases for which there really is degeneration. For those cases, the rule would need to require proof of material degeneration before the case is reopened.
- Administrative law judges are appointed for life. There is no persuasive justification for this. The lifetime rule is just a bureaucratic construct, not the constitutional rule that applies to federal court judges. Lifetime appointments make it easy for administrative law judges to grow lax in following the program’s requirements. Ten-year limits would seem to be the highest appropriate limit for the assignment.
Administrative law judges overturned the original denials in 70 percent of cases in 2008, and 67 percent of all cases were overturned in 2010. The Social Security Administration claims to have made some improvements in this regard, reducing the rate to only 56 percent in 2013.
In the course of studying this problem, investigators discovered that the Social Security Administration management, the administrative law judges, and their union claimed that no enforcement actions against overly lenient judges could be taken unless actual bribery were proved because their job descriptions granted them independence. The union objected that any managerial oversight would be political meddling. The fact that these folks have a union is prima facie evidence that they aren’t real judges. They are just senior hearing officers who need to adhere to standards and procedures to protect taxpayer money as well as grant benefits to the truly disabled. Eventually, the Social Security Administration changed the job descriptions, which was one of the improvements they claimed for 2013. 44
Physician scholars, such as Steven Snyder at the University of California, San Francisco, Medical School, have observed that the medical community has been aiding and abetting the bureaucratic preferences for giving out more benefits. Patients are increasingly likely to ask their physicians or other caregivers such as chiropractors, acupuncturists, and physical therapists to certify them as disabled. Many diagnoses such as back pain, depression, fatigue, and fibromyalgia are not easily verified objectively and can even be easily faked by scammers. Findings of MRI “abnormalities” are frequently used to justify disability owing to chronic back pain, yet there is no objective evidence that, in fact, these physical structures cause chronic back pain. What is more, vast numbers of people have the same observed abnormalities with no pain whatsoever. 45
Stopping excessive awards
We can hope that the modest improvements by the Social Security Administration will stick and become even stronger. We also need to insist on a complete overhaul of the approach and a systematic effort to unwind the bad decisions of recent decades. In addition to addressing the outright fraud and sloppy work habits, the government must return to the principle of disability meeting the legal requirement of “being unable to work any job in the national economy.” The entire set of rules is structurally deficient, such that even those administrators seeking to be just are hamstrung by inappropriate rules. For example, the statutory “unable to work any job in the national economy” has been replaced by the administrative rule “unable to perform a job that is equally physically demanding as jobs held in the past.” So, a steelworker who can no longer lift heavy parts would be granted disability even though the worker would have no physical challenge with electronic assembly work. That is a clear corruption of both the literal statutory language and its intent.
The disability political apparatus has also made it easier to qualify by the adoption of three administrative modifications to the underlying law. First, claimants can combine two or more nondisabling conditions to claim a benefit even though the net demonstrable effect still does not actually prevent them from working. Second, the administrative law judges in the Social Security Administration are required to give more weight to the opinions of the practitioners provided by the applicant in preference over the judgment of the government’s own experts. Third, applicants are not required to complete a course of remedial therapy that would allow them to regain some or all of their lost functions. Other countries have introduced reforms that require applicants to develop a rehabilitation plan for return to work with an employer and to demonstrate that they have followed through on it before being approved for disability payments. Such an approach reduced new approved cases by 60 percent in the Netherlands. 46
Once people are on taxpayer-financed disability, they almost never admit to recovery and take up productive work. Less than 1 percent of beneficiaries ever leave the scheme to return to work, yet research by Till von Wachter of the University of California, Los Angeles, suggests that at least half of those in the 30–44 age group could, in fact, return to work if they were required to do so. 47
The Americans with Disabilities Act (ADA) has placed a specific burden on employers to make reasonable accommodation for people with all sorts of disabilities. This means that someone with a disability that can be accommodated in some job somewhere should not be getting any government payouts for that disability while at the same time employers are spending money to accommodate it. It seems that for some portion of the disability determinations, the implicit qualification criterion has become that work is difficult, painful, annoying, unpleasant, or merely inconvenient.
Appendix F
An illustrative alternative for phasing in Medicare changes that avoid increasing its share of GDP
Notes
- Medicare and Medicaid Board of Trustees, “Table 4: Medicare Enrollment by Part and in Total,” supplementary data tables to 2017 Annual Report of the Boards of Trustees of the Federal Hospital Insurance and Federal Supplemental Medical Insurance Trust Funds(Washington: July 13, 2017).
- Center for Medicare and Medicaid Services, “2016 CMS Statistics,” 2016, pp. 9-10, based on data from the Social Security Administration, the Office of the Chief Actuary and Centers for Disease Control and Prevention, the National Center for Health Statistics, and the National Vital Statistics System.
- An average 80-year-old consumed approximately 69 percent more healthcare than an average 70-year-old in 1967, so as people live longer, one might expect that the average cost per person per year would also rise. But higher longevity is the result of better health, so, by 2013, the average 80-year-old consumed only 46 percent more healthcare than the average 70-year-old. Calculated by author from Center for Medicare and Medicaid Services, “Personal Health Care (PHC) Spending, Age and Gender Tables,” https://www.cms.gov/Research-Statistics-Data-and-Systems/Statistics-Trends-and-Reports/NationalHealthExpendData/Age-and-Gender.html; and Medicare Payment Advisory Commission, Health Care Spending and the Medicare Program, A Data Book(Washington: MedPAC, June 2017), p. 22. On average, spending for beneficiaries during their final year of life has been nearly four times greater than for the rest of the Medicare population. As the Medicare population became older, the age at which these higher terminal expenses were incurred shifted later, so some of the higher cost for older patients was merely a delay in their individual final costs, not a higher annual cost of continuing care. Furthermore, even the cost differential associated with the end of life dropped by about 15 percent from 2000 to 2014. Juliette Cubanski, Tricia Neuman, Shannon Griffin, and Anthony Damico, “Medicare Spending at the End of Life: A Snapshot of Beneficiaries Who Died in 2014 and the Cost of Their Care,” Kaiser Family Foundation, July 2016.
- National Safety Council, Accident Facts, 1994 edition, as reported by Thomas J. Kniesner and John D. Leeth, “Abolishing OSHA,” Regulation 18, no. 4 (1995): 46-56; and United States Department of Labor, Bureau of Labor Statistics, “Census of Fatal Occupational Injuries 2013,” updated from https://data.bls.gov/PDQWeb/fw.
- The last item was addition to the Medicare Provider Payment Modernization Act of 2014, “The ‘Doc-Fix’ Follies,” Wall Street Journal, March 15, 2014.
- Medicare and Medicaid Board of Trustees, “2017 Expanded and Supplementary Tables and Figures,” in 2017 Annual Report of the Boards of Trustees. Dollar amounts for 1967 (in 2016 dollars), the deductible as a percentage of average benefit, and the annual rates of change were computed by the author.
- The four so-called Medicare Savings Programs (MSP) are: Qualified Medicare Beneficiary (QMB)(1989); Qualified Disabled and Working Individual (QDWI)(1990); Specified Low-Income Medicare Beneficiary (SLMB)(1993); and the Qualifying Individual (QI)(1998). While the funding for these programs was taken from general revenue and assigned to the Medicaid program, they increased consumption and thereby raised Medicare’s expenses.
- The Social Security Increase from age 65 to age 67 has already begun, so there would necessarily be some confusion with two different and changing eligibility ages. Several techniques might be used to limit the confusion in practical terms, but for this discussion we assume they each rise from their current levels to age 67 in 2027 in equal annual steps. Social Security is being raised by two months per calendar birth year. Medicare would need to rise approximately twice that amount to harmonize by 2027.
- For a scholarly summary of the issue, see David H. Autor, “The Unsustainable Rise of the Disability Rolls in the United States: Causes, Consequences, and Policy Options,” MIT and NBER, November 23, 2011, https://economics.mit.edu/files/7388.
- Andrew Biggs, “Averting the Disability-Insurance Meltdown,” Wall Street Journal, February 24, 2015.
- Recent modest administrative adjustments have begun to reverse the trend. If they are sustained and expanded, that will be a good start on the reforms suggested here. Unfortunately, history is not encouraging in that respect. Similar reforms in the 1980s were soon eliminated, and the trend continued. See, for example, Eric Morath, “America’s Hidden Workforce Returns,” Wall Street Journal, January 16, 2019.
- .Biggs, “Averting the Disability-Insurance Meltdown.” For a detailed overview of Dutch and other international systems with more preliminary results, see Richard V. Burkhauser, Mary C. Daly, Duncan McVicar, and Roger Wilkins, “Disability Benefit Growth and Disability Reform in the U.S.: Lessons from Other OECD Nations,” Federal Reserve Bank of San Francisco, Working Paper 2013-40, December 2013.
- Till von Wachter, Jae Song, and Joyce Manchester, “Trends in Employment and Earnings of Allowed and Rejected Applicants to the Social Security Disability Insurance Program,” American Economic Review101, no. 7 (December 2001): 3308-29.
- For this intervention, the percentage reduction in the added expenditure is larger for the upper boundary, while for the other interventions, the percentage reduction is larger at the lower boundary. The other interventions reduce expenditures by similar amounts at both boundaries and thus have a larger effect on the smaller baseline of the lower boundary. But the upper boundary forecast includes a significantly larger forecast for the growth of disabled beneficiaries, so returning to the statutory criteria will have a much larger effect on it.
- The Kaiser Family Foundation and Health Research Educational Trust, Employer Health Benefits, 2017 Annual Survey(Menlo Park, CA: Kaiser, 2017), Figure 7.8. This is an average across all types of plans that have a general deductible—that is, one deductible that applies to hospitalization, medical, and drug combined. Many private plans do have some separate deductibles, especially for drugs, but these are not represented here.
- Note that the drug deductible (Part D) is for the base plan maximum deductible. Because Part D allows for some amount of market competition, a majority of drug plans have lower deductibles, or even none.
- Kaiser, Employer Health Benefits: 2017 Annual Survey, Figure 7.8.
- For fuller documentation of both the legislative and regulatory impediments to freedom of healthcare choice in the senior market, see Kent Masterson Brown, “The Freedom to Spend Your Own Money on Medical Care: A Common Casualty of Universal Coverage,” Cato Institute Policy Analysis no. 601, October 15, 2007.
- Patient responsibility for out-of-network costs may be even higher than the out-of-network coinsurance applied against the usual-and-customary charge because the provider is not contractually bound to accept the usual-and-customary amount and may balance-bill the patient for even more.
- The overall average was calculated by the author from service-specific percentages in Trudy Millard Krause, Maria Ukhanova, and Frances Lee Revere, “Private Carriers’ Physician Payment Rates Compared with Medicare and Medicaid,” Texas Medicine112, no. 6 (June 2016): e1. The Medicare-private fee differences vary widely by the particular service and also vary by geography and carrier. The differences have also grown over the last two decades. Compare S. Norton and S. Zuckerman, “Trends in Medicaid Physician Fees, 1993-1998,” Health Affairs 19, no. 4 (2000): 222-32; M. E. Miller, S. Zuckerman, and M. Gates, “How Do Medicare Physician Fees Compare with Private Payers?” Health Care Finance Review 14, no. 3 (1993): 25-39; W. Fox and J. Pickering, “Hospital and Physician Cost Shift: Payment Level Comparison of Medicare, Medicaid and Commercial Payers,” Milliman (December 2008); and J. Clemens and J. Gottlieb, “Bargaining in the Shadow of a Giant: Medicare’s Influence on Private Payment Systems,” NBER Working Paper no. 19503, October 2013.
- See for example, Toshiaki Iizuka, Katsuhiko Nishiyama, Brian Chen, and Karen Eggleston, “Is Preventive Care Worth the Cost? Evidence from Mandatory Checkups in Japan,” NBER Working Paper no. 23413, May 2017.
- This sensitivity is called “elasticity” by economists. This analysis uses an elasticity estimate of -0.2 for most of the calculations, and Medicare Trustee forecasts use the same value. See Amanda E. Kowalski, “Censored Quantile Instrumental Variable Estimates of the Price Elasticity of Expenditure on Medical Care,” NBER Working Paper no. 15085, June 2009; Joseph P. Newhouse and the Insurance Experiment Group, Free for All? Lessons from the RAND Health Insurance Experiment(Cambridge, MA: Harvard University Press, 1993); and Medicare and Medicaid Board of Trustees, 2017 Annual Report of the Boards of Trustees, p. 163. When dual-eligible beneficiaries go from zero out-of-pocket costs to any coinsurance/deductible, this analysis uses an elasticity of -0.35, as derived from the results of Katherine Baicker, Sarah L. Taubman, Heidi L. Allen, et al., “The Oregon Experiment—Effects of Medicaid on Clinical Outcomes,” New England Journal of Medicine368 (May 2, 2013): 1713-22, https://www.nejm.org/doi/full/10.1056/nejmsa1212321.
- Center for Medicare and Medicaid Services, MMCO_National_Profile_CY2012.xlsx, Table 1A: “Medicare and Medicaid Enrollment and Spending by Dual-Eligible Status, Age, and Other Characteristics by Year, CY 2012.”
- Medicare Payment Advisory Commission,June 2017 A Data Book: Health Care Spending and the Medicare Program, Charts 2-3 and 4-1, http://medpac.gov/docs/default-source/data-book/jun17_databookentirereport_sec.pdf. Calculations of percent difference by author.
- See, for example, Donald M. Berwick and Andrew D. Hackbarth, “Eliminating Waste in US Health Care,” Journal of the American Medical Association307, no. 14 (2012): 1513-16, doi:10.1001/jama.2012.362; and Mark Smith, Robert Saunders, Leigh Stuckhardt, and J. Michael McGinnis, Best Care at Lower Cost: The Path to Continuously Learning Health Care in America(Washington: National Academies Press, 2013).
- The baseline study on this point was Robert H. Brook, John E. Ware, Jr., William H. Rogers, et al., “The Effect of Coinsurance on the Health of Adults: Results from the Rand Health Insurance Experiment,” Rand Corporation, R-3055-HHS, 1984. While they found lower utilization with higher coinsurance, they found no effect on overall health except for reduced outcomes among the very poor and some people suffering from severe chronic conditions. More recently, a focused study of post-myocardial infarction patients found that with non-zero coinsurance they were not as compliant with drug regimens. The results were also lower for some secondary indicators, but not statistically different for the primary indicator of survival. See Niteesh K. Choudhry, Jerry Avorn, Robert J. Glynn, et al., “Full Coverage for Preventive Medications after Myocardial Infarction,” New England Journal of Medicine365, no. 22 (December 2011): 2088-97. Additional analysis of the experiment is provided by Katherine Baicker, Sendhil Mullainathan, and Joshua Schwartzstein, “Behavioral Hazard in Health Insurance,” National Bureau for Economic Research Bulletin of Aging Health 1 (2013): 2-3.
- The reductions from the plan design are smaller here than in Table 2 because the change is applied to a smaller population that has been reduced by the later eligibility age and tighter disability criteria.
- The increase in Medicare’s share of GDP was 117.89 percent of the increase for total federal spending. It was possible for Medicare’s contribution to be more than the total GDP because real expenditures for national defense and some smaller categories declined or rose more slowly than real GDP.
- The Medicare Board of Trustees acknowledges that their assumed controls will likely create disruptions in later years and need to be replaced. See Medicare and Medicaid Board of Trustees, 2017 Annual Report of the Boards of Trustees, p. 2.
- As part of the 2010 Affordable Care Act (ACA), spending for Medicare was nominally cut by $716 billion over the 10-year budget forecast horizon. Since there were no reductions in Medicare benefits (in fact, there were increases in the benefits for preventive care), the reduction was strictly notional on the wish that new schemes for manipulating reimbursements would result in savings. These hypothetical savings were used to offset the added real costs of the ACA subsidies to lower-middle-income insurance purchasers, thereby making the nominal cost of the ACA appear smaller than it really was. The legislative wishes are incorporated into the forecasts without further justification.
- The discussion here is about reduction of federal spending only. Figure A-1 includes some state and local spending, as well, to show the relative magnitudes of Medicare. While state and local spending would not be reduced explicitly to fund Medicare, the funding of Medicare through higher taxes or debt would likely reduce state and local spending.
- Medicare and Medicaid Board of Trustees,2017 Annual Report of the Boards of Trustees, p. 30. The rates cited here are the combined employee-employer rates.
- In the short to middle term, the increase in debt is more sensitive to the effective interest rate paid by the Treasury than to the rate of increase in Medicare spending. The upper and lower spending boundaries differ by just one year in the time required to reach the Greek debt level of 181.9 percent. See United States Central Intelligence Agency, “Country Comparison: Public Debt,” https://www.cia.gov/library/publications/the-world-factbook/rankorder/2186rank.html. Both the median and slow increase assumptions for interest rates are relatively conservative. The slower interest rate increase follows Congressional Budget Office projections for rate of change until the effective interest rate reaches the 25th percentile of historical rate levels (3.96 percent). See Congressional Budget Office, The Budget and Economic Outlook: 2017 to 2027(Washington: CBO, January 2017), Table 1-4. The median rise assumes reaching the historical median (6.12 percent) within 10 years.
- Biggs, “Averting the Disability-Insurance Meltdown.”
- National Safety Council, Accident Facts, 1994 edition, pp. 46-56; and United States Department of Labor, Bureau of Labor Statistics, “Census of Fatal Occupational Injuries 2013.”
- 36. Author calculated inflation comparison from Social Security Administration data, as reported in Damian Paletta, “Government Pulls in Reins on Disability Judges,” Wall Street Journal, December 27, 2013.
- 37.Computed by author from Social Security Administration, “Ratio of Covered Workers to Beneficiaries,” https://www.ssa.gov/history/ratios.html; and Medicare and Medicaid Board of Trustees, 2017 Annual Report of the Boards of Trustees, “Expanded and Supplementary Tables and Figures,” https://www.cms.gov/Research-Statistics-Data-and-Systems/Statistics-Trends-and-Reports/ReportsTrustFunds/index.html. Also note that the total number of government disability beneficiaries is almost 50 percent higher than these numbers as the result of yet more government disability programs. The net result is that only 12 people work and pay the taxes for each person that benefits from a government disability check.
- Biggs, “Averting the Disability-Insurance Meltdown.”
- For detailed analysis of the disincentives to work, see Nicole Maestas, Kathleen J Mullen, and Alexander Strand, “Disability Insurance and the Great Recession,” American Economic Review Papers and Proceeding105, no. 5 (May 2015): 177-82.
- Social Security Disability Programs: Improving the Quality of BenefitAward Decisions, Permanent Subcommittee on Investigations of the Committee on Homeland Security and Governmental Affairs, United States Senate, September 13, 2012.
- Paletta, “Government Pulls in Reins on Disability Judges.”
- Mark J. Warshawsky and Ross A. Marchand, “Disability Claim Denied? Find the Right Judge,” Wall Street Journal, March 9, 2015.
- This discussion builds on an outline suggested by Warshawsky and Marchand, “Disability Claim Denied?”
- Paletta, “Government Pulls in Reins on Disability Judges.” See also, “At-A-Glance: The Significance of Changes to the Position Description of ‘Administrative Law Judge’ in the Social Security Administration,” Association of Administrative Law Judges, which compares the new and old position descriptions. The analytical conclusions represent the interests of the administrative law judge union, but the content is straightforward.
- Steven Snyder, “Disability: If You Build a Program, They Will Come,” Wall Street Journal, September 18, 2018.
- Biggs, “Averting the Disability-Insurance Meltdown.”
- Biggs, “Averting the Disability-Insurance Meltdown.”
John F. Early is president of Vital Few, LLC, a consultancy in mathematical economics, and has twice served as an assistant commissioner at the Bureau of Labor Statistics.
From: Cato.org