Fascinating variations — Weather made (sort of) understandable: Part Two
By Dr. Jay Lehr, Terigi Ciccone
As we did in Part One of this series of essays on the weather, we shall start with what you may believe is a shocking exclamation. Weather is nothing more and nothing less than nature trying to equilibrate the balance of all energy transmitted to the Earth by the Sun. It is a never-ending multi-level physics show trying to overcome imbalances and irregularities too numerous to quantify accurately. Yet, we try hour after hour, day after day, all across the Earth.
TEMPERATURE AND LOCALIZED DIFFERENCES
There are significant temperature differences between the air in valleys and air at the top of the mountains. In Figure 1, we see snows on top of Mount Kilimanjaro in Africa. While Mt Kilimanjaro is on the equator, the higher up you go on the mountain, it no longer has equatorial temperatures. It gets very cold. It’s so tall and massive that it creates its own sub-weather system. The top of the mountain 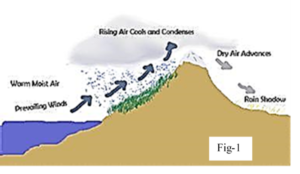 is cold enough to snow and accumulate it. The low atmospheric pressure there literally sucks up much of the available water vapor/air from miles around its base. This rising air/ water vapor condenses and becomes clouds. Then it precipitates on the colder northern side of the mountain in the form of rain or snow, depending on temperature and pressure differences.
So, when it’s snowing on top of Kilimanjaro, say it’s 29° F, it accumulates, but in the valley, below it maybe 80° F. Therefore, the hot air from the valley starts to rush up the mountain quickly, and when it reaches near the top, some of the snow melts in the air, and it rains. But some of the snow does something strange. Because of the lower boiling point at high elevations, the snow is heated so rapidly that it turns directly into water vapor, a process called sublimation. The snow is melting so fast that it does not bother to first liquefy into water. It goes straight to the gas phase, water vapor. As the cold air strips and condenses the water vapor as it’s sucked up the mountain, it’s condensed on the colder mountainside. There it rains or snows, but the other, warmer side of the mountain, is an arid wasteland. Ecologically speaking, the weather system is in a dynamic balance, but the people, animals, and vegetation on the mountain’s wrong side have difficult living conditions. A balanced ecosystem is not necessarily a “good” system for all.
An even more prominent example of this extreme temperature/pressure difference and its cycle is in the tropical Pacific Ocean. Here this similar upward rush of air from the western Pacific Ocean to the sky is so fast that it is the primary driver of the now- familiar and periodic El Niño, which creates a temporary atmosphere and is the air/water equivalent to that of Kilimanjaro. After some years, the process reverses, causing the cooling cycle, which we call La Niña. This cycle was only recently discovered, and we still have a lot to learn about it.
THE WATERS
Let’s now compare the properties of water and water vapor and see how they affect the weather. Keep in mind that 20-30 percent of the Sun’s’ energy never reaches the land or the oceans. Some is reflected back to outer space by the air and the clouds, and some is absorbed by the atmosphere and clouds.
More than 70 percent of the Earth’s surface is covered and filled with water, accounting for about 96 percent of all Earth’s water. The rest of the 4 percent exists as water vapor in the air, flowing in rivers, stored in lakes, in icecaps and glaciers, and in the ground as soil moisture and as groundwater in aquifers.
How water heats up, cools down, loses, and redistributes the Sun’s heat is very different than how the land and air do it. Water, primarily in the oceans, receives the Sun’s rays. Before the rays penetrate the shallow surface water, a significant amount is reflected by the water back through the air, where some is stored in the air and /clouds, which creates “the greenhouse effect.” The seas absorb the rest of the Sun’s rays/heat. But water absorbs the Sun’s energy/heat, mostly from the infrared rays (IR) and the visible wavelengths, and it does so much more slowly than land. The oceans can absorb and store four times more heat than the air. The heated water on top expands, which makes it is less dense than the colder water. As a result, the warmer waters keep rising to the top layers; whereas, the more frigid, denser waters sink and keep sinking to the bottom. At great depths, these colder waters remain for centuries or even many millennia.
The warmer waters generally stay within 100-200 meters from the ocean top, and the temperatures keep declining as we go deeper and deeper. These top 100 meters of warmer waters may move at about one or two miles per hour and may take a decade or more to redistribute and mix with adjacent cooler waters. But they are still generally limited to the top 100-200 meters. The coldest of the cold waters are at the deepest parts of the ocean, and the mixing speeds there may be less than 1 one inch per century. The tiny amount of warmer water that is mixed with the colder waters below is generally limited to conduction. The warmer top layers in the seas are also why ocean ice, icebergs, and coastal glaciers will continue to melt around the waterline, even when the air temperature is below the freezing point.
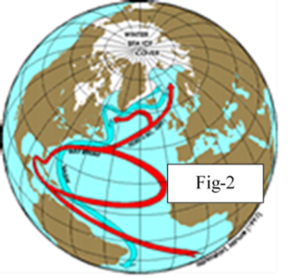 This also explains why so much fog is over the oceans where the warm waters on the surface continue to evaporate up and then condense as it comes into contact with the colder air on top. The different water temperatures of the oceans redistribute locally and over the planet at very different rates. The best-known example of this temperature redistribution is the Gulf Stream of the Atlantic Ocean. As seen in Figure – 2, the flow speeds of the top layers of the Gulf Stream can reach a breakneck pace of about 5 five miles per /hour. But it gets slower and slower as we go deeper and deeper. All told, it takes about 500 years for these top layers of water to complete the full Gulf Stream cycle.
In Part 3 of this series, we will close with a few more of the weather’s intricacies, which make those who can successfully forecast long-range, like months, not years, real superstars. Remember, most of us have not been taking the Farmer’s Almanac forecasts for the coming year too seriously, yet we actually pay attention to those that tell us the Earth is doomed in a decade or more.
Portions of this article are excerpted from the 2020 book A HITCHHIKER’S JOURNEY THROUGH CLIMATE CHANGE by Terigi Ciccone and Dr. Jay Lehr. The book is the best source for parents and grandparents to explain climate change reality to their children. It’s especially recommended for young teens and Gen-Z as they will bear the consequences of climate change folly.
Available from Amazon at https://www.amazon.com/Hitchhikers-Journey-Through-Climate-Change-ebook/dp/B086R49RS6 In kindle, black and white paperback and large format full-color figures. Or send an email to terigiciccone@gmail.com.
Authors
Dr. Jay Lehr
CFACT Senior Science Analyst Jay Lehr has authored more than 1,000 magazine and journal articles and 36 books. Jay’s new book A Hitchhikers Journey Through Climate Change written with Teri Ciccone is now available on Kindle and Amazon.
Terigi Ciccone
Engineer, Science Enthusiast and Artist. Loves reading and travel, Naturalist, Author of the new book “A Hitchhiker’s Journey Through Climate Change.”
From cfact.org