
Manufacturing climate change deceptions — Part Two
By Dr. Jay Lehr, Terigi Ciccone
It is astonishing how scientifically accurate data is used to create massive deceptions—namely involving man’s ability to overpower Mother Nature and control the thermostat of planet Earth.
While we are clearly not conspiracy theorists, man-caused global warming or climate change (take your pick) has been a mechanism used across the world to grow governments, converge to a one-world government and defeat capitalism in favor of world socialism. The tool of choice is the use of well-chosen facts, casting aside facts not considered useful in order to deceive. In science, this is called cherry-picking. Lacking ethics, one chooses only the facts that support their beliefs while ignoring those that don’t.
In the first of this two-part series, we used material directly from government reports pointing out the information missing in order to make a dishonest presentation of information to the public. We are doing the same here.
The article presented in black segments below allows us to illustrate how NASA/NOAA and the UN/IPCC promote deception, using deliberate omissions to create a false understanding for the casual reader. In this essay, we focus on the last half of the article that features NASA’s comments on Mars, Venus and our Sun in their efforts to convince the reader that humanity controls Earth’s thermostat.
The article is from the National Aeronautics and Space Agency (NASA), which appeared on September 16, 2020, is reproduced without any changes other than formatting for convenient reading. The original can be found by clicking here. You may want to read the original first.
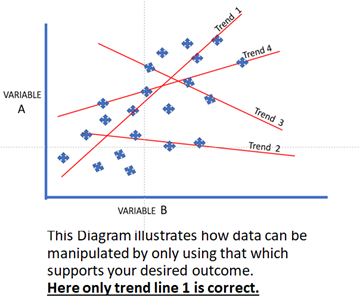 In blue type following each final segment of the NASA article, we provide commentary on the deceptions NASA has created. Without all the facts, the casual reader will arrive at the author’s desired false impression. An example of how incomplete information creates a false impression is shown in Figure 1.
Here we consider all the data available on the relationship between A and B, which could be dependent variables such as how A (Sun’s radiation) and B (atmospheric temperature) vary with each other. Looking at all the data, the relationship shown as Trend 1 is clearly correct. However, if we choose to use only a small selection of data, we can arrive at any trend we desire. This is the technique many government agencies use to achieve false impressions.
Not enough greenhouse effect: [11] The planet Mars has a very thin atmosphere, nearly all carbon dioxide. Because of the low atmospheric pressure, and with little to no methane or water vapor to reinforce the weak greenhouse effect, Mars has a largely frozen surface that shows no evidence of life.
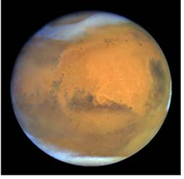 [11] A true statement is implying an outright deception. Mars is a dead planet for many reasons, none of which have anything to do with CO2 or human activities.
Too much greenhouse effect: [12] The atmosphere of Venus, like Mars, is nearly all carbon dioxide. But Venus has about 154,000 times as much carbon dioxide in its atmosphere as Earth (and about 19,000 times as much as Mars does), producing a runaway greenhouse effect and a surface temperature hot enough to melt lead.
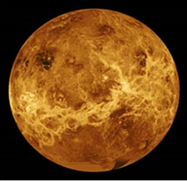 [12] NASA is again misleading us by omission. Venus is much closer to the Sun and hotter. Its atmosphere is 90 times denser than the earth’s, and its barometric pressure would crush a person into a pancake. Venus is a veritable hell on wheels and inhospitable to life for many reasons other than CO2.
On Earth, human activities [13] are changing the natural greenhouse. Over the last century the burning of fossil fuels like coal and oil has increased the concentration of atmospheric carbon dioxide (CO2). This happens because the coal or oil burning process combines carbon with oxygen in the air to make CO2. To a lesser extent, the clearing of land for agriculture, industry, and other human activities has increased concentrations of greenhouse gases.
[14] The consequences of changing the natural atmospheric greenhouse are difficult to predict, but certain effects seem likely:
[13] NASA makes several factual statements, but let us see what it does not tell us. What they do not tell us are the proportional values and comparative context. For example: (1) Yes, we caused an increase in total CO2 but did not tell us that the human-caused increase is maybe only a few percent of total CO2. (2) NASA fails to tell us by how much and what is the percent of the consequences are attributable to humanity. See a detailed explanation of all the variables and their comparative contributions in the book “A HITCHHIKER‘S JOURNEY THROUGH CLIMATE CHANGE.”
[14] In the below four bullets, note the repeated use of words “Probably,” “May,” “Possibly,” “Could.” The bottom line, NASA does not know what increased or decreased levels of CO2 do in the atmosphere. This is especially true with clouds in the phase changes of water vapor to liquid or solid. And neither do the classical skeptical scientists. The science is simply too difficult, not well understood, and impossible to model accurately.
- On average, Earth will become warmer. Some regions may welcome warmer temperatures, but others may not.
- Warmer conditions will probably lead to more evaporation and precipitation overall, but individual regions will vary, some becoming wetter and others dryer.
- A stronger greenhouse effect will warm the oceans and partially melt glaciers and other ice, increasing sea level. Ocean water also will expand if it warms, contributing further to sea level rise.
- Meanwhile, some crops and other plants may respond favorably to increased atmospheric CO2, growing more vigorously, and using water more efficiently. At the same time, higher temperatures and shifting climate patterns may change the areas where crops grow best and affect the makeup of natural plant communities.
The Role of Human Activity
In its Fifth Assessment Report, the Intergovernmental Panel on Climate Change, a group of 1,300 independent scientific experts from countries all over the world under the auspices of the United Nations, concluded there’s a more than 95 percent probability that human activities over the past 50 years have warmed our planet.
The industrial activities that our modern civilization depends upon have raised atmospheric carbon dioxide levels from 280 parts per million to 412 parts per million in the last 150 years. The panel also concluded there’s a better than 95 percent probability that human-produced greenhouse gases such as carbon dioxide, methane and nitrous oxide have caused much of the observed increase in Earth’s temperatures over the past 50 years.
The United Nations’ IPCC panel’s full report “Summary for Policymakers” is online https://www.ipcc.ch/site/assets/uploads/2018/02/ipcc_wg3_ar5_summary-for-policymakers.pdf.
Solar Irradiance
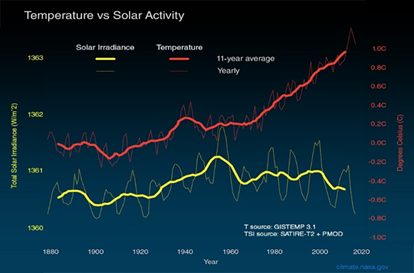 The graph [15] compares global surface temperature changes (red line) and the Sun’s energy that Earth receives (yellow line) in watts (units of energy) per square meter since 1880. The lighter/thinner lines show the yearly levels while the heavier/thicker lines show the 11-year average trends. Eleven-year averages are used to reduce the year-to-year natural noise in the data, making the underlying trends more obvious.
[15] NASA uses only “Surface Temperatures” to measure the global temperature because they are easy to manipulate and have been manipulated. This manipulation was the fudging that was exposed in 2009 by the “ClimateGate” scandal. If it were replaced it with Satellite temperatures, the red line would have the same trend as the yellow line.
The amount of solar energy that Earth receives has followed the Sun’s natural 11-year cycle of small ups and downs with no net increase since the 1950s. Over the same period, global temperature has risen markedly. It is, therefore, extremely unlikely [16] that the Sun has caused the observed global temperature warming trend over the past half-century. Credit: NASA/JPL-Caltech.
[16] This is written by a NASA lawyer, leading you to think the way they want you to think. At face value, I would agree if it said “unlikely,” but more important is what they do not say on possible other causes for the warming, as discussed above, especially galactic cosmic rays and volcanic activities.
It’s reasonable to assume that changes in the Sun’s energy output would cause the climate to change, since the Sun is the fundamental source of energy that drives our climate system.
[17] Classical scientists do not know the role of TSI in climate change; perhaps it‘s little more than a thermostat that‘s telling the furnace what to do. See our discussions above on the causes of climate change.
[18] Indeed, studies show that solar variability has played a role in past climate changes. For example, a decrease in solar activity coupled with an increase in volcanic activity is thought to have helped trigger the Little Ice Age between approximately 1650 and 1850, when Greenland cooled from 1410 to the 1720s and glaciers advanced in the Alps.
[18] A truthful statement to set up the ensuing deception, but don‘t‘ tell us when, why, or how TSI stopped being a factor.
[19] But several lines of evidence show that current global warming cannot be explained by changes in energy from the Sun:
[19] If NASA had used the satellite temperatures instead of the fudged Surface Temperatures, they could not make this statement.
Since 1750, the average amount of energy coming from the Sun either remained constant or increased slightly.
[20] If the warming were caused by a more active Sun, then scientists would expect to see warmer temperatures in all layers of the atmosphere. Instead, they have observed a cooling in the upper atmosphere and a warming at the surface and lower parts of the atmosphere. That’s because greenhouse gases are trapping heat in the lower atmosphere.
[20] Satellite data shows global warming stopped about 20-years ago, matching the TSI decline. It‘s only the fudged NASA surface temperature that continues to increase because they manufactured the increase.
[21] Climate models that include solar irradiance changes can’t reproduce the observed temperature trend over the past century or more without including a rise in greenhouse gases.
[21] Climate models cannot accurately reproduce anything with any accuracy. Climate models have been and continue to be notoriously inaccurate, showing increases by 2 – 3 degrees C more than the actual satellite and balloon data.
We all pay a considerable price for the misleading and irresponsible NASA articles.
– The newspapers/media quickly pick them up and use them to fabricate threatening headlines to sell themselves and their political goals, socialism, and a one-world government.
– Politicians use the headlines to gain support from an uninformed public—teachers poison students with fear of a future that will not occur.
We trust that this two-part tutorial will help the reader better understand the curtains that too many government agencies use to pull over the public’s eyes.
Author
Dr. Jay Lehr
CFACT Senior Science Analyst Jay Lehr has authored more than 1,000 magazine and journal articles and 36 books. Jay’s new book A Hitchhikers Journey Through Climate Change written with Teri Ciccone is now available on Kindle and Amazon.
Terigi Ciccone
Engineer, Science Enthusiast and Artist. Loves reading and travel, Naturalist, Author of the new book “A Hitchhiker’s Journey Through Climate Change.”
From cfact.org