
The clever ruse of sea level alarm
By Dr. Jay Lehr and Tom Harris
For the past 50 years, scientists have been studying climate change and the possibility of related sea level changes resulting from melting ice and warming oceans. Despite the common belief that increasing levels of carbon dioxide (CO2) in our atmosphere could result in catastrophic sea level rise, there is no evidence to support this fear. Tax monies spent trying to solve this non-existent problem are a complete waste.
There is another widely held misconception: that all the oceans of the world are at the same level. In reality, sea level measurements around the world vary considerably, typically by several inches. Prevailing winds and continental instability are among the variables that make measurements difficult, but the varying results of rising sea levels are extremely accurate.
The National Oceanographic and Atmospheric Administration (NOAA) of the United States updated its coastal sea level tide gauge data in 2016 at the request of the previous administration. These measurements continue to show no evidence of accelerating sea level rise.
The measurements include tide gauge data at coastal locations along the West Coast, East Coast, Gulf Coast, Pacific Ocean, Atlantic Ocean and Gulf of Mexico, as well as seven Pacific Island groups and six Atlantic Island groups, comprising more than 200 measurement stations.
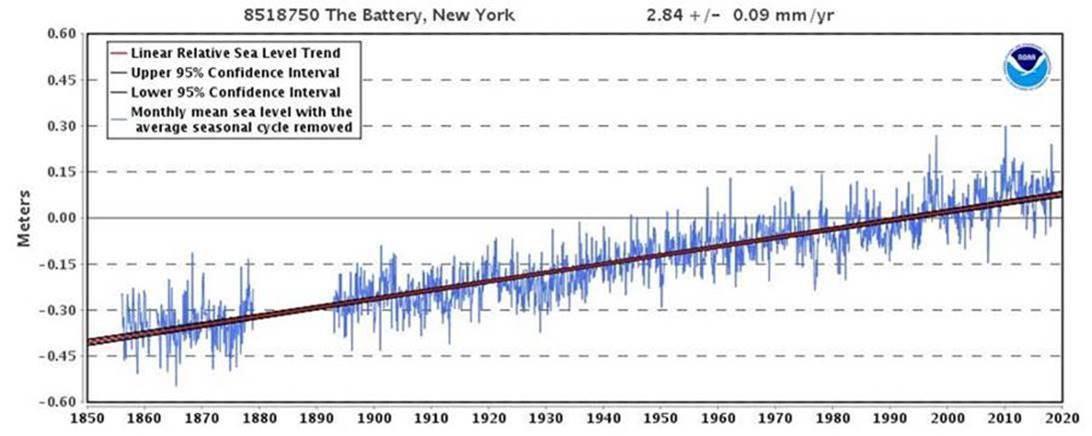
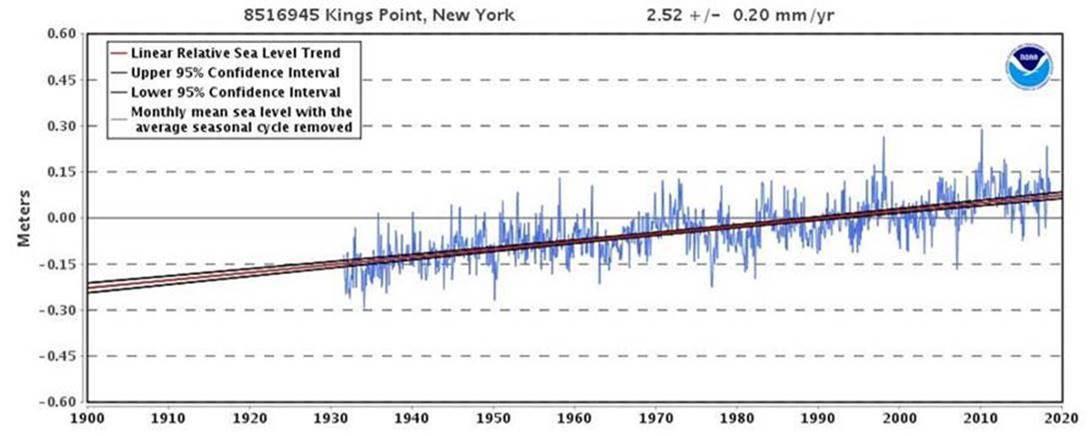
The longest running NOAA tide gauge record of coastal sea level in the U.S. is in New York City at Battery Park. Its 160-year record shows a steady sea level rise of 11 inches per century. A few miles away at Kings Point, New York is a station whose 80-year record shows about the same.
Both locations show a steady, unchanging sea level rise rate whether temperature has been rising or falling (see below figures). Indeed, The Battery measurements showed the same rate of sea level rise well before the existence of coal power plants and SUVs as today.
The 2016 updated NOAA tide gauge record included data for California coastal locations at San Diego, La Jolla, Los Angeles and San Francisco. The measured rates of sea level rise at these locations vary between four inches and nine inches per century. NOAA data provide assessments with a 95% confidence level at all measured locations.
In contrast to these steady but modest real-world rising sea level rates, the United Nations Intergovernmental Panel on Climate Change (IPCC) claims that sea levels all over the world will almost immediately begin rising far faster than before. Not only do NOAA records contradict such claims for U.S. and selected island coasts; this pattern of steady but modest sea level rise is being observed all across the world, despite rising CO2 and fluctuating average global temperatures.
The IPCC and its supporters are not able to provide convincing evidence to support their concerns about dangerous warming-driven sea level rise, as rising temperatures have rarely pushed sea level rise beyond one foot per century. Current sea level rise trends have stayed essentially constant over the past 90 years, despite the rise of atmospheric CO2 levels from less than 300 parts per million (ppm) as the Little Ice Age ended and modern industrial era began, to today’s 410 ppm.
Dire predictions made decades ago of dramatically accelerating polar ice loss, and an ice-free Arctic Ocean, have simply not come to pass. Dr. Steven E. Koonin, former Undersecretary for Science in the Obama administration, noted in The Wall Street Journal on September 19, 2014: “Even though the human influence on climate was much smaller in the past, the models do not account for the fact that the rate of global sea-level rise 70 years ago was as large as what we observe today.”
We can test the rising-seas hypothesis with real data collected from ten widely-distributed coastal cities with long and reliable sea level records in addition to those listed above. Those cities are indicated on the map below.
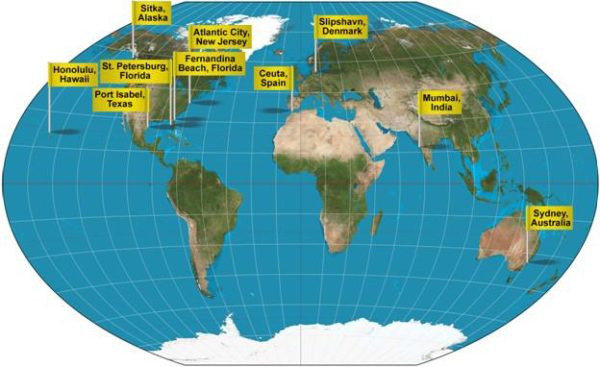
Source: https://en.wikipedia.org/wiki/World_map, modified.
Each of these cities has well-documented, long-term sea level rise data, from which linear extrapolations can be made for the next 100 years. Here are three samples of the data available on the NOAA web site:
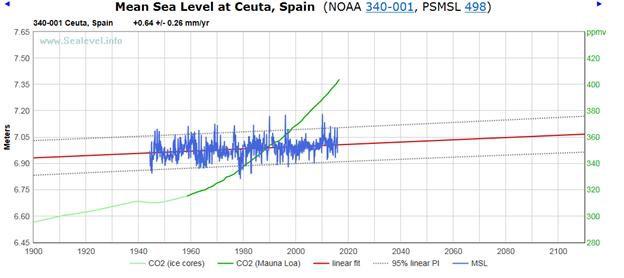
The Ceuta, Spain data show a nearly flat trend. Most notably, the data show no correlation between CO2 concentration and sea-level rise. If the current trend continues for the next century, the sea level in Ceuta will rise only three inches. This is in sharp contrast to the 10-foot global rise in sea levels recently projected by former NASA scientist James Hansen.
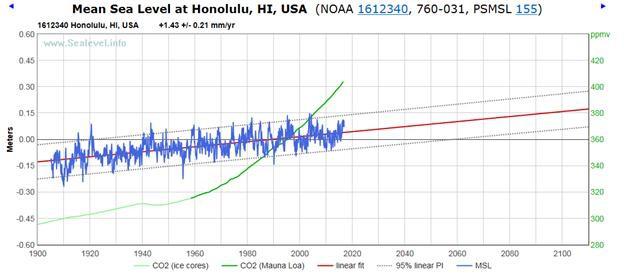
Like some other regions, Hawaii can see significant year-to-year fluctuations in sea level because of global oceanic currents or local plate tectonic movements. However, Honolulu has seen an average sea-level rise of only 5.6 inches since 1900. The sea level around Honolulu is projected to rise a mere 5.6 inches in the next 100 years, once again with no correlation to CO2 levels.
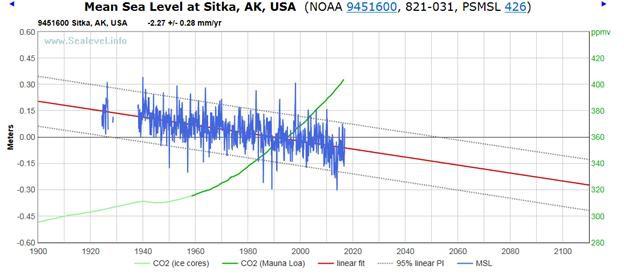
In contrast to these other locations, the sea level trend in Sitka, Alaska has been downward, not upward. If the rate of change continues, sea level will fall nine inches over the next 100 years. Note that Sitka is only about 100 miles from Glacier Bay and 200 miles from the Hubbard Glacier on Disenchantment Bay. If melting glaciers were causing sea levels to rise, one would expect to see it in Alaska.
Of course, the Sitka anomaly could be due to rising land masses, as is the case in other parts of the world. Still other locations – such as the Norfolk, Virginia area – are prone to land subsidence, the result of groundwater withdrawals from subsurface rock formations and/or to isostatic changes in nearby areas that cause some land masses to rise while others fall in elevation.
Here is the forecast sea level rise over the next century for the remaining seven cities on the map:
Atlantic City, New Jersey – 16 inches
Port Isabel, Texas – 15.4 inches
St. Petersburg, Florida – 10.7 inches
Fernandina Beach, Florida – 8.3 inches
Mumbai/Bombay, India – 3.12 inches
Sydney, Australia – 2.7 inches
Slipshavn, Denmark – 3.6 inches.
The observational data and projected sea level trends for these ten coastal cities lead to three obvious conclusions:
There has been no dramatic sea level rise in the past century, and evidence-based projections show no significant or dangerous rise is likely to occur in the coming century.
There is no evidence to indicate that the rate of sea level rise (or fall) in any of these areas will be substantially different than has been the case over the past decades or even century.
There is no correlation between atmospheric CO2 concentrations and sea level rise. The steady but modest rise in sea level pre-dated coal power plants and SUVs, and has continued at the same pace even as atmospheric CO2 concentrations rose from 280 parts per million to 410 parts per million.
Claims about dangerously rising sea levels, and island nations being submerged by them – as a result of human fossil fuel use and manmade global warming – are nothing more than a clever ruse, designed to frighten people into demanding or accepting terrible energy policies.
Those policies would cause nations the world over to give up abundant, reliable, affordable coal, oil and natural gas … and replace these fuels with unreliable, weather-dependent, expensive wind, solar and biofuel energy. The results would be devastating – for economies, jobs, manufacturing, food production, poor families and the environment.
From: cfact.org