
Insights from the Idaho Freedom Index
What it can tell us about the makeup of our Legislature
By Brian Almon
With the 2024 legislative session coming to a close on Wednesday, Freedom Index scores for lawmakers are essentially finalized. Staff at the Idaho Freedom Foundation (IFF) will double check the numbers for accuracy before releasing the printed booklet, but they are complete enough to start drawing some conclusions.
(Disclosure: I worked for IFF in 2023 and contracted with the organization during the recent session. I am not currently an employee nor am I under contract at this time. Everything I write here is my own opinion.)
The Freedom Index is not the be-all end-all of evaluating legislators, of course. It doesn’t capture how many bills a lawmaker sponsored or how he or she voted in committee. It also doesn’t reflect how much work a lawmaker did behind the scenes to promote good bills or defeat bad ones. Nevertheless, it is a useful data point. If two lawmakers are within 5% of each other, then you’ll need to find other data points to help make your decision. However, if you have one in the 80s and another in the 30s, you can be certain that the former is much more conservative than the latter.
The Freedom Index is the most comprehensive legislative scorecard in Idaho, and possibly in the nation. IFF policy experts analyzed hundreds of bills based on a transparent twelve-point rubric:
- Does it create, expand, or enlarge any agency, board, program, function, or activity of government?
Conversely, does it eliminate or curtail the size or scope of government? - Does it transfer a function of the private sector to the government? Examples include government ownership or control of any providers of goods or services such as the Land Board’s purchase of a self-storage facility, mandatory emissions testing, or pre-kindergarten.
Conversely, does it eliminate a function of government or return a function of government to the private sector? - Does it give government any new, additional, or expanded power to prohibit, restrict, or regulate activities in the free market?
Conversely, does it eliminate or reduce government intervention in the market? - Does it increase barriers to entry into the market? Examples include occupational licensure, the minimum wage, and restrictions on home businesses.
Conversely, does it remove barriers to entry into the market? - Does it directly or indirectly create or increase any taxes, fees, or other assessments?
Conversely, does it eliminate or reduce any taxes, fees, or other assessments? - Does it increase government redistribution of wealth? Examples include the use of tax policy or other incentives to reward specific interest groups, businesses, politicians, or government employees with special favors or perks; transfer payments; and hiring additional government employees.
Conversely, does it decrease government redistribution of wealth? - Does it increase government spending (for objectionable purposes) or debt?
Conversely, does it decrease government spending or debt? - Does it in any way restrict public access to information related to government activity or otherwise compromise government transparency, accountability, or election integrity?
Conversely, does it increase public access to information related to government activity or increase government transparency, accountability, or election integrity? - Does it violate the principle of equal protection under the law? Examples include laws which discriminate or differentiate based on age, gender, or religion or which apply laws, regulations, rules, or penalties differently based on such characteristics.
Conversely, does it restore or protect the principle of equal protection under the law? - Does it directly or indirectly create or increase penalties for victimless crimes or non-restorative penalties for nonviolent crimes?
Conversely, does it eliminate or decrease penalties for victimless crimes or non-restorative penalties for non-violent crimes? - Does it violate the spirit or the letter of either the United States Constitution or the Idaho Constitution? Examples include restrictions on speech, public assembly, the press, privacy, private property, or firearms.
Conversely, does it restore or uphold the protections guaranteed in the US Constitution or the Idaho Constitution? - Does it violate the principles of federalism by increasing federal authority, yielding to federal blandishments, or incorporating changeable federal laws into Idaho statutes or rules? Examples include citing federal code without noting as it is written on a certain date, using state resources to enforce federal law, and refusing to support and uphold the Tenth Amendment.
Conversely, does it restore or uphold the principles of federalism?
Voters are, of course, free to disagree with any of these metrics, and there is a small amount of subjectivity involved in how you might interpret them. However, honest conservatives should be able to agree with most of these metrics. Legislators can justify expanding government or increasing welfare programs all they want, but they cannot in good faith claim that those are conservative principles.
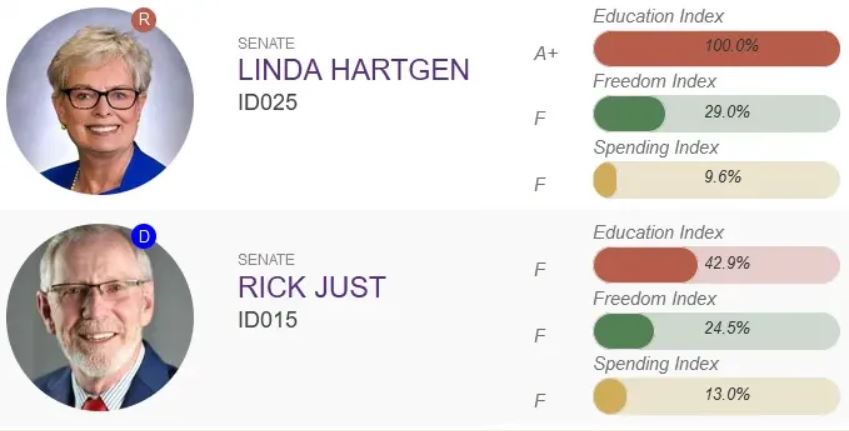
No Democrat scored higher on the Freedom Index this year than any Republican, which is to be expected. Sen. Linda Hartgen was the lowest scoring Republican at 29% while Sen. Rick Just was the highest scoring Democrat at 24.5%. Hartgen therefore appears to be much more aligned with progressive principles than conservative ones.
The average score for the entire Legislature this year is 52.5%, with the Senate at 50.9% and the House at 53.3%. If you average just Republicans, then the Legislature creeps up to 58.9%.
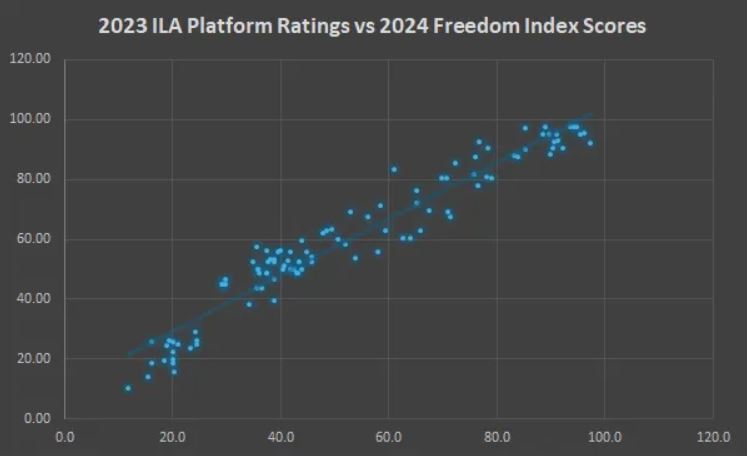
This seems low for a state with a Republican supermajority, doesn’t it? The Institute for Legislative Analysis (ILA) recently developed a platform rating score, measuring lawmakers against the Idaho Republican Party Platform based on 40-odd votes in the 2023 session. It lines up reasonably closely with the Freedom Index. This is not IFF arbitrarily ranking legislators, as its detractors claim. This is as objective a metric as there is for how conservative our lawmakers really are.
In fact, I plotted the 2023 platform ratings against the 2024 Freedom Index ratings and the results were striking. Even though these came from two different sessions, even though the Freedom Index measures several hundred bills while the ILA selected a few dozen, and even though they use different standards, they correlate incredibly well. It turns out a conservative is a conservative, a moderate a moderate, and a progressive a progressive no matter what metrics you use.
There were two distinct caucuses within the Republican Party this year. Conservative legislators organized the Idaho Freedom Caucus (IDFC), while moderate Republicans organized the Main Street Caucus (MSC). Public members of the IDFC averaged a score of 91.6% on the Freedom Index, while public members of the MSC averaged merely 37.3%. Republicans who do not publicly affiliate with either caucus scored an average of 61.8%.

The median score for the entire Legislature this year was 44.4%. Only one member of the Main Street Caucus scored higher than the median (Sen. Todd Lakey at 53.9%) while the lowest scoring member of the Idaho Freedom Caucus was Rep. Joe Alfieri at 85.2%.
Allow me to use my own representatives as a case study in what the Freedom Index does and does not measure:

Rep. Josh Tanner scored 90.0% on the Freedom Index this year while Rep. Ted Hill scored 65.8%. Yet if when it comes to headline issues, they both voted similarly. Tanner and Hill both voted for H406, mandatory minimum sentences for fentanyl trafficking, despite IFF scoring it -4. Both voted for H415, allowing teachers to carry concealed in public schools, which was rated +2 but did not get a hearing in the Senate.
Both Tanner and Hill voted for H417 to make sure government offices will always accept cash. Both supported H421 to properly define male and female. Both voted for H493, prohibiting mask mandates, another bill that got stuck in a Senate drawer. Tanner cosponsored H515, death penalty for aggravated sexual assault of a child, to which Hill also voted aye. Both voted yes on H525, curtailing the authority of health districts.
Hill sponsored H538, stopping government offices from forcing employees to use alternative pronouns, and Tanner supported it as well. Both lawmakers voted in favor of H545, prohibiting cities from forcing landlords to accept federal housing assistance. Both supported the ultimate version of the library bill, H710.
You get the picture. So how did Josh Tanner score nearly 25 points higher than Ted Hill? The answer comes from the little bills, the ones that don’t make headlines.
For example, H399 replaced the defunct Maternal Mortality Review Board with a mandate for the Board of Medicine to collect the same data. IFF opposed this bill because this sort of thing is usually used to recommend expanding government. Hill voted aye while Tanner voted nay.
H592 established a fund to allow the Idaho Dept. of Agriculture to compensate livestock owners for losses due to predator attacks. IFF pointed out that this creates a new government program to solve a problem created by government, as it is a federal agency that reintroduced wolves and grizzly bears in the first place. Hill voted aye while Tanner voted nay.
Our lawmakers vote on hundreds of bills each year, both in committee and on the floor. While some issues grab headlines, the growth of government often occurs in the margins, just a little bit here and a little bit there. A good conservative lawmaker will vote well on the headline issues, while the great ones hold the line on the little things too.
As I said above, this does not take into account everything a legislator does. Josh Tanner worked for months last year to find ways to trim the budget for the Idaho Dept. of Health and Welfare. Ted Hill carried a lot of controversial bills, often putting himself in the line of rhetorical fire. Both are unopposed in this year’s primary, but all of these data points should still be taken into account by voters in LD14.
The Freedom Index also reveals how geographically divided we are as a state. Only four lawmakers from east of Boise scored higher than 70% — Sen. Glenneda Zuiderveld (88.4%) and Reps. Julianne Young (79.0%), Kevin Andrus (76.4%), and Barbara Ehardt (72.3%). The average score for districts 1-23 is 57.6% while districts 24-35 score 42.8%. If we eliminate Boise from the first group, combining districts 1-14 and 20-23, the score climbs to 66.9%. (Boise, comprising districts 15-19, scores 22.0% by itself.)

It’s entirely possible that many low-scoring legislators accurately represent their voters. However, it’s also likely that most voters don’t pay close attention to how their representatives actually vote. Politics is a necessary evil for most people, and so they decide based on mailers, maybe a town hall meeting or two, or who is most well known in the community.
There are several cases in which districts have a large discrepancy between lawmakers. In LD1, for example, Sen. Scott Herndon scored 94.8% while Rep. Mark Sauter scored 41.9%. Which is more representative of his voters? Similarly, in LD6, Sen. Dan Foreman scored 91.0% while Rep. Lori McCann scored 38.7%. In both cases, the lower scoring representative has two conservative challengers this year, which might explain how a conservative district can end up with a moderate or even progressive lawmaker. A legislator who appears grossly out of step with his or her district invites challenges, but if two candidates split the conservative vote then nothing changes.
The Freedom Index is a valuable data point for voters to consider as they decide who should represent them for the next two years. While it doesn’t capture everything that goes into the job of serving in the House or Senate, it nevertheless reveals where the Gem State stands in relation to conservative principles. The Legislature’s median score of 44.4% sits right between Reps. Melissa Durrant at 44.8% and Megan Blanksma at 43.9%. 35 Republican lawmakers scored below this median, which is pretty sad, to be honest. Imagine what a Legislature with an average score of 80% could accomplish!
I’ll continue digging into data from the recent session over the next few weeks. Make sure to sign up to receive a digital or paper copy of the 2024 Freedom Index as soon as it is ready. Let’s get these numbers higher in 2025!